
Review the key concepts, formulae, and examples before starting your quiz.
🔑Concepts
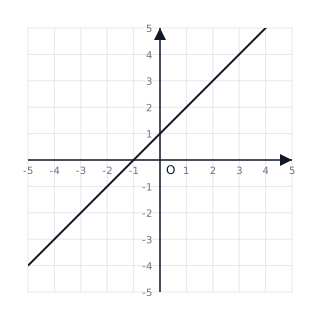
Linear graphs represent a constant rate of change. The equation defines a straight line where is the gradient (slope) and is the -intercept. A positive slopes upwards from left to right, while a negative slopes downwards.
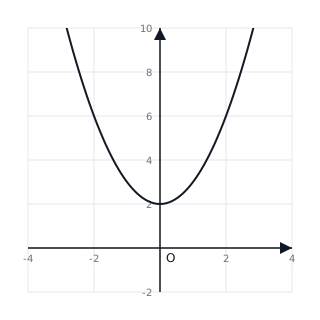
Quadratic graphs follow the form and create a 'U' or 'n' shaped curve called a parabola. If , the curve opens upwards; if , it opens downwards. Key features include the vertex (turning point) and the -intercept (at ).
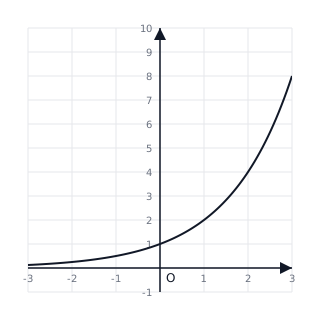
Exponential graphs have the form or where . These graphs grow or decay rapidly and never cross the x-axis ( is an asymptote). If , the graph shows growth; if , it shows decay.
Perpendicular lines intersect at right angles. Their gradients and are negative reciprocals of each other, meaning . For example, if a line has a gradient of , the perpendicular line has a gradient of .
📐Formulae
(Gradient formula)
(Slope-intercept form)
(Quadratic formula to find x-intercepts)
(X-coordinate of the vertex of a quadratic)
(Condition for perpendicular lines)
💡Examples
Problem 1:
Find the equation of the line passing through the points and .
Solution:
Explanation:
First, calculate the gradient: . Substitute and point into : . Thus, .
Problem 2:
Find the coordinates of the turning point for the quadratic graph .
Solution:
Explanation:
The x-coordinate of the vertex is . Substitute back into the original equation to find : .
Problem 3:
Determine the value of for the exponential graph if it passes through the point .
Solution:
Explanation:
Substitute the coordinates into the equation: . Since , the equation becomes . Dividing both sides by 8 gives .
Problem 4:
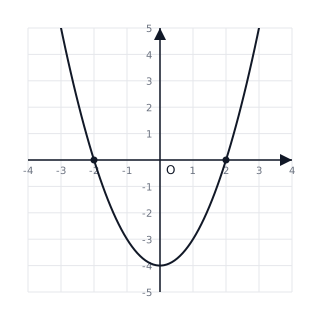
Identify the -intercepts of the quadratic function .
Solution:
- To find -intercepts, set : .
- Factor the difference of squares: .
- Solve for : or .
Explanation:
The -intercepts are the points where the curve crosses the horizontal axis. For a quadratic of the form , the intercepts are always .
Problem 5:
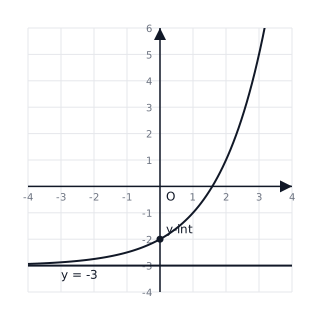
A curve has the equation . (a) Find the -intercept of the graph. (b) Identify the equation of the horizontal asymptote. (c) Sketch the graph of the function showing its behavior as increases and decreases.
Solution:
(a) To find the -intercept, set : The -intercept is .
(b) As , . Therefore, . The horizontal asymptote is .
(c) As increases, grows exponentially. When , . When , .
Explanation:
Exponential graphs of the form have a horizontal asymptote at . The -intercept is found by evaluating the function at . Since , the graph shows exponential growth, rising steeply as becomes more positive.