
Review the key concepts, formulae, and examples before starting your quiz.
🔑Concepts
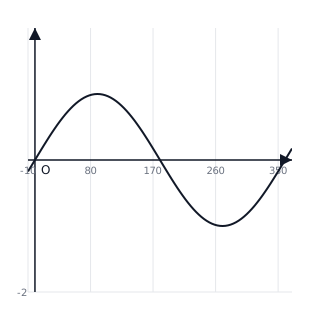
The sine function represents a wave starting at the principal axis. The parameter affects the amplitude, determines the period, and shifts the graph vertically.
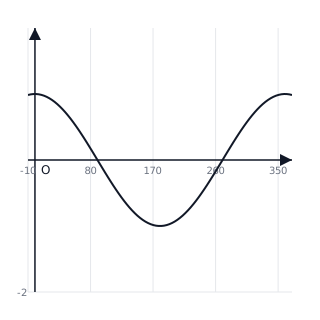
The cosine function starts at its maximum value (when ). It follows the same periodic behavior as sine but is shifted horizontally.
The period of a function is the horizontal distance required to complete one full cycle. For or , the period is calculated as .
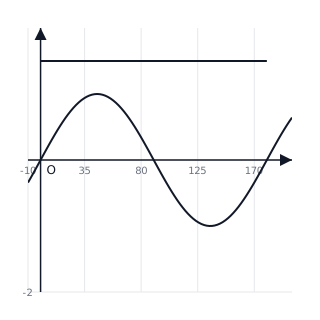
Vertical translation shifts the midline of the graph. The maximum value is and the minimum value is .
📐Formulae
💡Examples
Problem 1:
Determine the amplitude, period, and midline of the function .
Solution:
The amplitude is . The value of is , so the period is . The midline is .
Explanation:
Identify from the standard form . The amplitude is the coefficient of the sine term, the period is divided by , and the midline is the constant added to the function.
Problem 2:
Find the equation of a cosine function that has a maximum value of , a minimum value of , and a period of .
Solution:
- Midline .
- Amplitude .
- Period factor . Equation: .
Explanation:
First find the vertical center (midline) and the distance from the center to the peak (amplitude). Then calculate using the period formula. Substitute these into the general cosine equation.
Problem 3:
Describe the transformations required to map onto .
Solution:
The graph is translated to the right (horizontal shift) and units downwards (vertical shift).
Explanation:
In the form , the value indicates a horizontal shift right, and indicates a vertical translation down.
Problem 4:
Identify the equation of the trigonometric function shown in the graph, which has a maximum at , a minimum at , and completes one cycle at .
![Graph of y = 2sin(3x) + 2 showing a period of 120 and range [0, 4].](https://s3.ap-south-1.amazonaws.com/prod-kritclub/science-diagrams/90d42924c0f482f9f87d302c54f5690291b6c821b730d8f5fb98edc16a1321b8.svg)
Solution:
- Find the amplitude: .
- Find the midline: .
- Find the period: The graph completes a cycle at , so .
- Since the graph starts at the midline and goes up, it is a sine function: .
Explanation:
The amplitude is half the distance between peak and trough. The midline is the average of the peak and trough. The frequency factor is found by dividing the standard period by the observed period.
Problem 5:
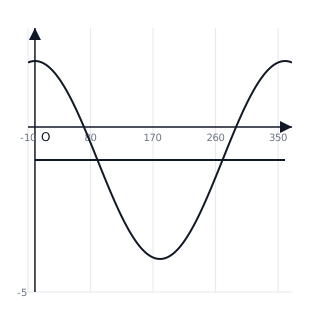
Sketch the graph of for and determine its range.
Solution:
- Amplitude is .
- Midline is .
- Maximum value .
- Minimum value .
- Range is .
- The graph starts at , crosses the midline at , hits the minimum at , and returns to the maximum at .
Explanation:
To sketch a cosine graph, plot the five key points: the start (max), first intercept (midline), middle (min), second intercept (midline), and end (max).