
Review the key concepts, formulae, and examples before starting your quiz.
🔑Concepts
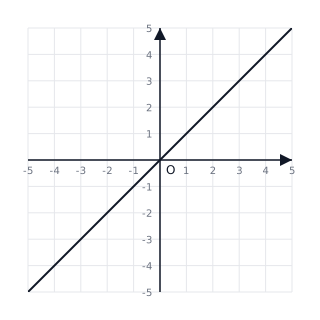
The Identity Function is defined by for all . Its graph is a straight line passing through the origin at an angle of with the positive -axis. The domain and range are both the set of all real numbers .
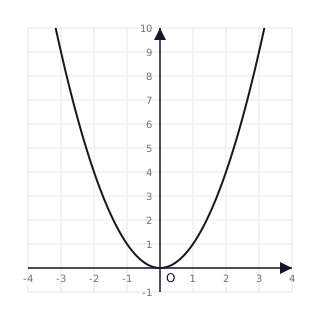
The Square Function is defined by . It produces a symmetric curve called a parabola. Since any real number squared is non-negative, the range of this function is , while the domain is .
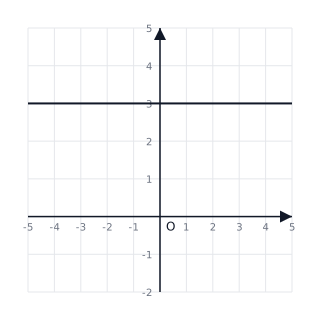
The Constant Function is defined by , where is a fixed real number. Regardless of the input , the output remains . Its graph is a horizontal line parallel to the -axis.
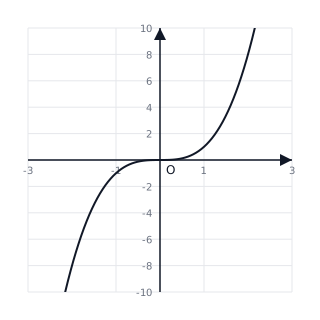
The Cube Function is defined by . It is an odd function because , meaning the graph is symmetric with respect to the origin. The domain and range are both .
📐Formulae
💡Examples
Problem 1:
Find the domain and range of the real function .
Solution:
To find the domain, the expression under the square root must be non-negative: So, Domain . For the range, as takes values from to , takes all non-negative real values. Range .
Explanation:
Square root functions are only defined for non-negative values in the set of real numbers. The output of a principal square root is always non-negative.
Problem 2:
Sketch the graph and find the domain and range of .
Solution:
The function can be rewritten as: Which simplifies to: Domain: (All real numbers). Range: because the absolute value is never negative.
Explanation:
The graph is a V-shape shifted units to the left on the -axis. The vertex is at .
Problem 3:
If and are two real functions, find and .
Solution:
Explanation:
Operations on functions are performed by adding or multiplying their respective algebraic expressions for the same input .
Problem 4:
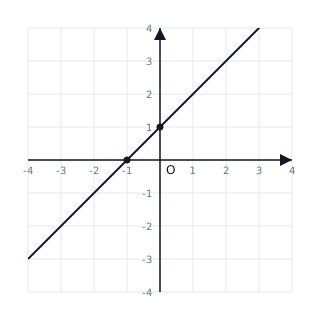
Sketch the graph of the function and identify its intercepts.
Solution:
- This is a linear function of the form where and .
- To find the -intercept, set : . Point is .
- To find the -intercept, set : . Point is .
- Drawing a line through these points gives the graph of the function.
Explanation:
Linear functions always result in straight lines. The constant term represents the shift along the -axis.
Problem 5:
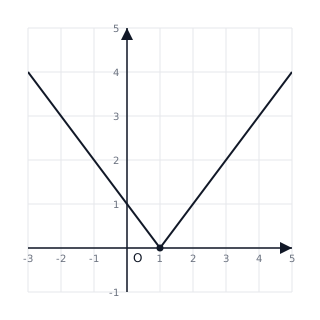
Draw the graph of the absolute value function .
Solution:
- The base function is , which has a 'V' shape with a vertex at .
- The function shifts the vertex of the graph 1 unit to the right.
- When , . For , . For , .
- The domain is and the range is .
Explanation:
The expression results in a horizontal translation of the modulus graph by units.