
Review the key concepts, formulae, and examples before starting your quiz.
🔑Concepts
A logarithmic function is the inverse of an exponential function . Its domain is and its range is . The graph always passes through and has a vertical asymptote at .
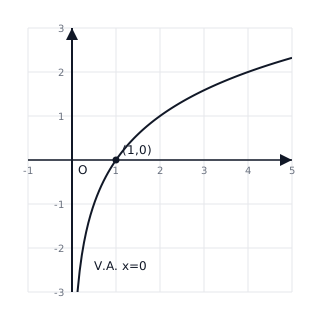
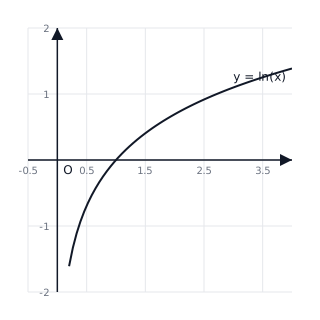
The base of a logarithm determines the steepness of the curve. Natural logarithms use base () and are written as . Common logarithms use base and are written as .
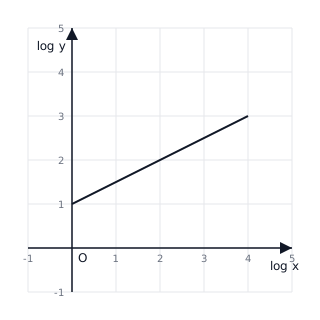
Logarithmic scales are used to linearize power-law relationships. If , then . Plotting against results in a straight line with gradient and intercept .
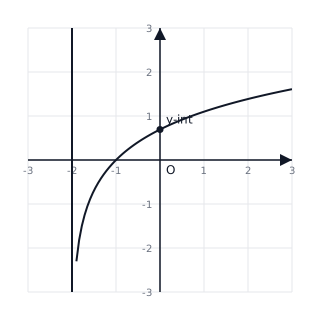
Transformations of logarithmic functions involve vertical stretching/compression (), horizontal translation (), and vertical translation (). The vertical asymptote shifts to .
📐Formulae
💡Examples
Problem 1:
Solve the equation for . Give your answer to 3 significant figures.
Solution:
Explanation:
Take the logarithm of both sides to bring the exponent down using the power rule. Then, isolate and use a calculator to evaluate the final value.
Problem 2:
A population of bacteria grows according to the model , where is time in hours. Find the time it takes for the population to reach 2000.
Solution:
Explanation:
Divide both sides by 500 to isolate the exponential term. Take the natural logarithm () of both sides to cancel the base , then solve for .
Problem 3:
The relationship between two variables is given by . Show how this can be written as a linear equation.
Solution:
Explanation:
By applying the product and power laws of logarithms, a power function is transformed into a linear form where the gradient is the original exponent.
Problem 4:
Given the function , find the coordinates where the graph intersects the -axis and state the equation of the vertical asymptote.
Solution:
- To find the -intercept, set : So the -intercept is .
- The vertical asymptote occurs where the argument of the log is zero: . The equation of the vertical asymptote is .
Explanation:
Logarithmic functions shift horizontally based on the value added to or subtracted from inside the function. Here, the graph shifts 2 units to the left.
Problem 5:
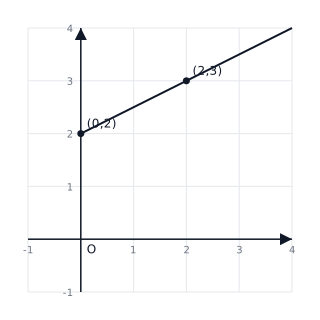
Data for the variables and suggest a relationship of the form . When is plotted against , a straight line is formed passing through and . Determine the values of and .
Solution:
- Express the equation in linear form: .
- This is in the form where , , , and .
- Calculate the gradient : . So .
- Use the -intercept : . . Final values: , .
Explanation:
By applying log laws, a power model can be transformed into a linear model. The gradient of the log-log plot is the exponent and the intercept is .