
Review the key concepts, formulae, and examples before starting your quiz.
🔑Concepts
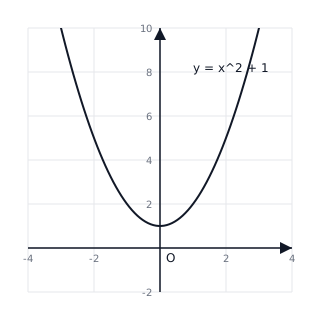
Quadratic graphs of the form are called parabolas. If , the parabola opens upwards (U-shaped) and has a minimum point. If , it opens downwards (n-shaped) and has a maximum point. The -intercept is always at .
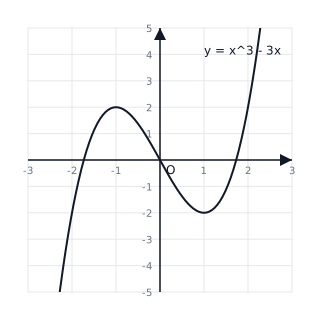
Cubic graphs of the form typically have an 'S' shape. They can have up to two turning points and always cross the -axis at least once.
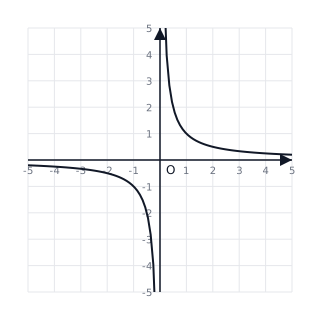
Reciprocal graphs create hyperbolas. They have two separate branches and asymptotic behavior, meaning the curve approaches the and axes but never touches them (for ).
Square reciprocal graphs are always positive (if ) and are symmetric about the -axis. They are often referred to as 'chimney' or 'volcano' graphs.
📐Formulae
General Quadratic:
Quadratic Formula:
Axis of Symmetry for Quadratic:
General Cubic:
Reciprocal: or
💡Examples
Problem 1:
Given the function , find the coordinates of the turning point (vertex).
Solution:
- Find the x-coordinate of the symmetry axis: .
- Substitute into the function: .
- Turning point is .
Explanation:
The turning point of a quadratic is the minimum or maximum point. Using is the fastest way to find its location.
Problem 2:
Identify the horizontal and vertical asymptotes for the function .
Solution:
- Vertical Asymptote: Set denominator to zero: .
- Horizontal Asymptote: As becomes very large, approaches 0, so approaches 5. .
Explanation:
Asymptotes are lines that the curve approaches. A vertical asymptote occurs where the function is undefined (division by zero).
Problem 3:
Use the graph of to estimate the solutions to .
Solution:
- Plot the curve .
- Draw the horizontal line on the same grid.
- Identify the x-coordinates where the line and the curve intersect.
Explanation:
In IGCSE exams, 'solving graphically' means finding the intersection points between the function curve and a specific constant line or another function.
Problem 4:
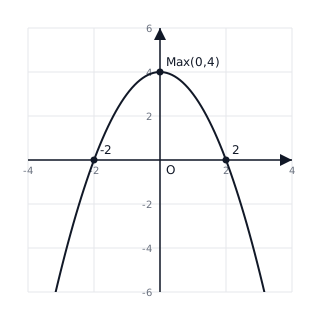
Sketch the graph of for . State the coordinates of the maximum point and the -intercepts.
Solution:
When , . So the -intercept (and maximum point) is . For -intercepts, set : Intercepts are and .
Explanation:
This is a quadratic function where , so it is an inverted U-shape. The maximum point occurs at the vertex. We find intercepts by setting and respectively.
Problem 5:
Draw the graph of for values from to . Use the graph to solve .
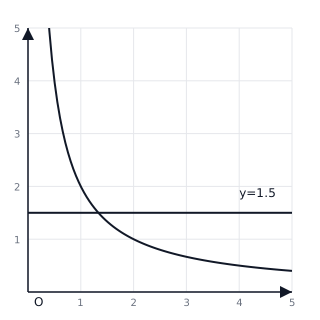
Solution:
Points for the graph: Drawing a horizontal line at gives:
Explanation:
Create a table of values to plot the curve. To solve the equation graphically, identify the -coordinate where the curve intersects the line .