
Review the key concepts, formulae, and examples before starting your quiz.
🔑Concepts
A functional relationship is a rule that connects an 'input' value to an 'output' value. For every input, there is exactly one specific output. We can visualize this using a function machine where a number goes in, a rule is applied, and a result comes out.

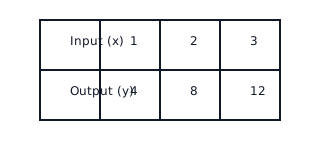
Patterns in tables help us identify the relationship between (the independent variable) and (the dependent variable). If increases by a constant amount as increases by 1, the relationship is additive (e.g., ) or multiplicative (e.g., ).
On a coordinate plane, functional relationships are represented by plotting ordered pairs . If the relationship is linear, all points will fall on a straight line. The horizontal axis represents the input () and the vertical axis represents the output ().
A multiplicative relationship always passes through the origin because if the input is , then will always be . In contrast, an additive relationship will pass through .
📐Formulae
(Additive Relationship)
(Multiplicative Relationship)
(Combined Relationship)
(Ordered Pair for Graphing)
💡Examples
Problem 1:
Look at the following pattern in a table. If the Input () is and the Output () is , find the rule and determine the output when the input is .
Solution:
Step 1: Compare each pair. , , . The difference between and is always . Step 2: Write the rule: . Step 3: Substitute into the rule: . Step 4: Calculate the final result: .
Explanation:
This is an additive relationship. Since the output is consistently units higher than the input, we apply the rule to find any unknown value.
Problem 2:
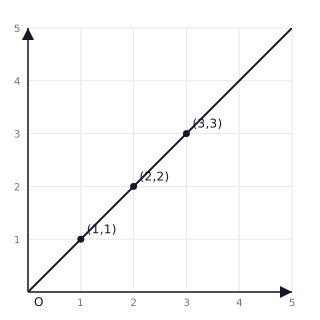
A graph shows a line passing through the points , , and . What is the functional rule represented by this graph, and what would be the value if ?
Solution:
Step 1: Analyze the relationship between and for each point. For , . For , . For , . Step 2: Since the ratio is constant, the rule is multiplicative: . Step 3: To find the value at , calculate . Step 4: .
Explanation:
By checking the coordinates on the graph, we see that is always triple the value of . This identifies a multiplicative rule, which we then use to calculate the output for the given input.
Problem 3:
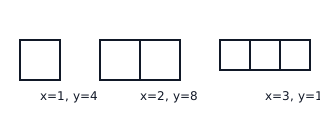
Observe the relationship between the number of squares and the number of matches used to build them. For 1 square, 4 matches are used. For 2 squares, 8 matches are used. For 3 squares, 12 matches are used. Identify the rule and find how many matches are needed for squares.
Solution:
If : 80 matches are needed.
Explanation:
Comparing the input (squares) to the output (matches), we see that the output is always 4 times the input. This is a multiplicative relationship where the constant .
Problem 4:
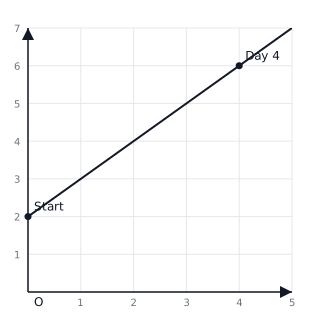
A plant starts at a height of cm and grows cm every day. The relationship is shown on a graph. What is the rule for the height () after () days, and what is the height on day 4?
Solution:
On day 4 ():
Explanation:
Since the plant starts at 2 cm (the -intercept when ) and increases by 1 each day, we add the number of days to the starting height. This is an additive relationship.