
Review the key concepts, formulae, and examples before starting your quiz.
🔑Concepts
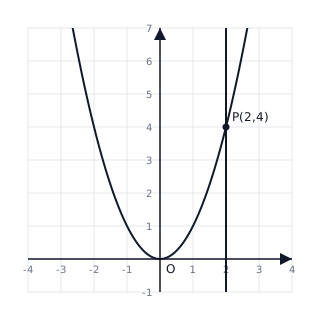
A function is a rule that assigns each element in set (Domain) to exactly one element in set (Codomain). The actual set of outputs produced is the Range. Visually, the vertical line test determines if a graph represents a function: a vertical line must cross the graph at most once.
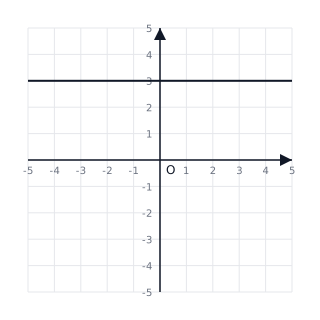
The Constant Function is defined by for all , where is a constant. Its graph is a horizontal line parallel to the x-axis. The domain is and the range is the singleton set .
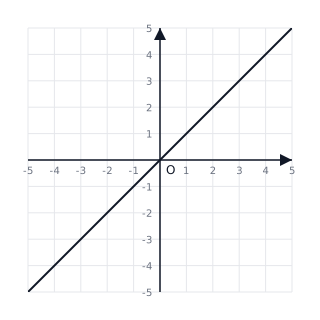
The Identity Function assigns every real number to itself. Its graph is a straight line passing through the origin at an angle of with the positive x-axis. Domain = , Range = .
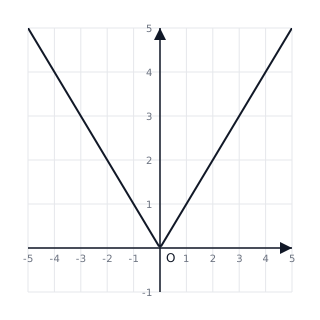
The Modulus (Absolute Value) Function returns the non-negative value of . The graph is V-shaped with the vertex at the origin. Domain is , and Range is .
📐Formulae
where
💡Examples
Problem 1:
Find the domain and range of the function .
Solution:
- For the function to be defined, the expression inside the square root must be non-negative: .
- Solve the inequality: , which gives . Thus, Domain .
- To find the range, let . Since it is a square root, .
- Squaring both sides: .
- Since , we have , so .
- Combining and , the Range is .
Explanation:
The domain is restricted by the square root condition (radicand ). The range is restricted by both the output of the square root (always non-negative) and the maximum value of the radicand.
Problem 2:
Find the domain of .
Solution:
- The function is a rational function, so it is defined for all except where the denominator equals zero.
- Set the denominator to zero: .
- Factor the quadratic: .
- Find the roots: and .
- Therefore, the domain is the set of all real numbers except and .
- In interval notation: Domain or .
Explanation:
For rational functions, the numerator can be anything, but the denominator cannot be zero as division by zero is undefined in real numbers.
Problem 3:
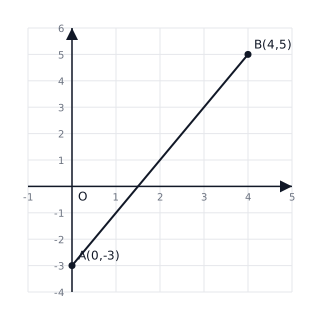
Draw the graph and determine the range of the function for the domain .
Solution:
- Find the values at the boundaries: When . When .
- Since it is a linear function, the graph is a line segment connecting and .
- Range: Looking at the y-values, the range is .
Explanation:
For a linear function over a closed interval , the range is the interval between and .
Problem 4:
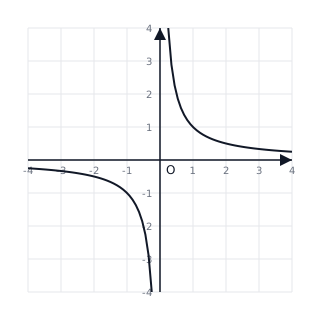
Identify the domain and draw the graph of the reciprocal function .
Solution:
- The function is defined for all real numbers except where the denominator is zero. Thus, .
- Domain: .
- As . As . The graph consists of two branches in the first and third quadrants.
Explanation:
The graph is a rectangular hyperbola with asymptotes at and . It never touches either axis.