
Exploring Mixtures and their Separation - Interpret solubility graphs and relate mixture behaviour to everyday contexts
Review the key concepts, formulae, and examples before starting your quiz.
🔑Concepts
Solubility is the maximum amount of solute that can be dissolved in of a solvent at a specific temperature. It generally increases with temperature for solids in liquids, which can be visualized using a solubility curve where the x-axis represents temperature and the y-axis represents solubility.
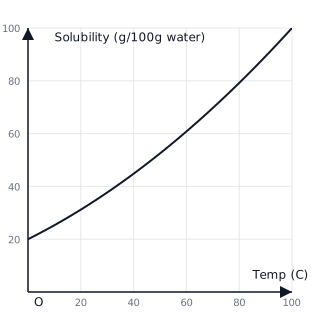
A saturated solution contains the maximum amount of solute possible at a given temperature. If the temperature is lowered, the solubility decreases, and the excess solute precipitates out as crystals.

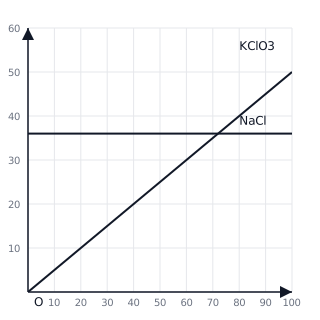
The solubility of different salts varies at the same temperature. For example, at , Sodium Chloride () has a different solubility compared to Potassium Chlorate (). This behavior allows for the separation of mixtures through fractional crystallization.
Everyday applications of solubility include the preparation of syrup (saturated sugar solutions) and the production of salt from seawater through evaporation, where the concentration of salt eventually exceeds its solubility limit.

📐Formulae
💡Examples
Problem 1:
A solution contains of sugar dissolved in of water. Calculate the concentration in terms of mass by mass percentage of the solution.
Solution:
Mass of solute (sugar) = . Mass of solvent (water) = . Total mass of solution = . Using the formula:
Explanation:
To find the mass percentage, we first determine the total mass of the solution by adding the solute and solvent. We then divide the mass of the solute by the total mass and multiply by .
Problem 2:
The solubility of Potassium Nitrate is at and at . If a saturated solution containing of water is cooled from to , what mass of crystals will be deposited?
Solution:
Mass of solute in saturated solution at . Mass of solute in saturated solution at . Mass of crystals deposited: The mass of crystals deposited is .
Explanation:
When a saturated solution is cooled, its capacity to hold solute decreases. The difference between the solubility at the higher temperature and the lower temperature represents the amount of solute that can no longer remain dissolved and precipitates out as crystals.
Problem 3:
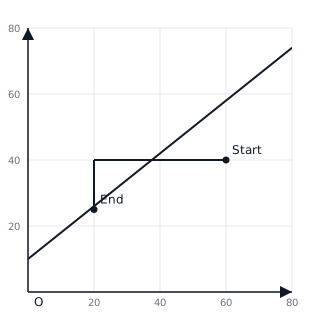
A student dissolves of a salt in of water at . According to the provided graph, the solubility at is and at is . If the solution is cooled to , how many grams of salt will crystallize out?
Solution:
Therefore, of salt will crystallize.
Explanation:
Since the student only dissolved initially (which is less than the max at ), the solution was unsaturated. Upon cooling to , the water can only hold . The remaining must leave the liquid state.
Problem 4:
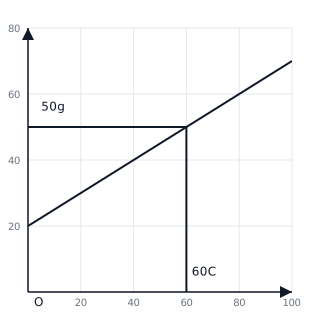
Based on the solubility graph for Salt X, what is the minimum temperature required to dissolve of the salt in of water? The solubility follows the linear equation .
Solution:
We are given . Using the equation: The minimum temperature required is .
Explanation:
To dissolve a specific mass, the temperature must be high enough such that the solubility limit is equal to or greater than that mass. By solving the solubility-temperature relation, we find the exact threshold.