
Review the key concepts, formulae, and examples before starting your quiz.
🔑Concepts
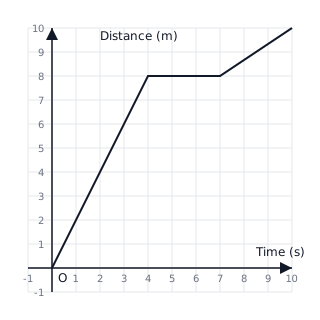
Distance-Time graphs represent the relationship between the distance traveled and time taken. The gradient of the graph represents the speed of the object. A horizontal line indicates that the object is stationary (distance remains constant).
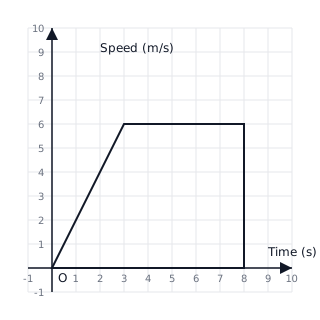
Speed-Time graphs show how velocity changes over time. The gradient represents acceleration (), where a positive gradient is acceleration and a negative gradient is deceleration. The area under the graph represents the total distance traveled.
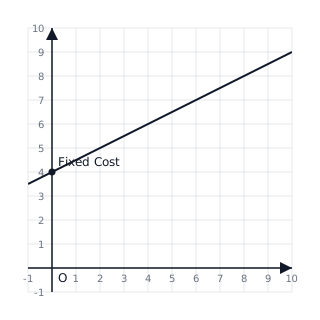
Real-world linear graphs often take the form , where represents the initial value (the -intercept) and represents the rate of change (gradient). For example, in a phone contract graph, would be the fixed monthly fee and would be the cost per minute of calls.
Conversion graphs are used to change values between two different units (e.g., Celsius to Fahrenheit or Kilometers to Miles). These are typically straight lines passing through the origin if the units are directly proportional.
📐Formulae
💡Examples
Problem 1:
A car travels from point A to point B. It covers km in hours. It then stops for minutes. Finally, it travels another km in hour. Calculate the average speed for the entire journey.
Solution:
Explanation:
To find the average speed, we sum all distances and divide by the total time elapsed, including the time the car was stationary.
Problem 2:
A cyclist accelerates from rest to a speed of m/s in seconds. They then maintain this speed for seconds before coming to a stop in another seconds with constant deceleration. Calculate the total distance traveled.
Solution:
Explanation:
The distance is the area under the speed-time graph. We divide the area into three parts: the acceleration phase (triangle), the constant speed phase (rectangle), and the deceleration phase (triangle).
Problem 3:
A water tank is being filled. The volume in liters after minutes is given by the graph of . Identify the initial volume and the rate at which the tank is being filled.
Solution:
Explanation:
In a linear practical graph, the y-intercept represents the starting value (at ) and the gradient represents the constant rate of change.
Problem 4:
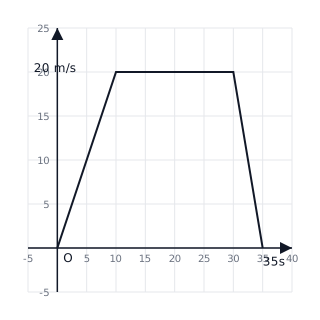
A car accelerates from m/s to m/s in seconds. It then travels at this constant speed for seconds before decelerating to a stop in seconds. Calculate the total distance traveled during the journey.
Solution:
- Total distance is the area under the speed-time graph.
- Divide the area into three parts: a triangle ( to s), a rectangle ( to s), and a triangle ( to s).
- Area 1 (Triangle): m
- Area 2 (Rectangle): m
- Area 3 (Triangle): m
- Total distance: m
Explanation:
The distance in a speed-time graph is found by calculating the area of the shape formed between the line and the x-axis. Here, it forms a trapezium, which can be split into simpler shapes for easier calculation.
Problem 5:
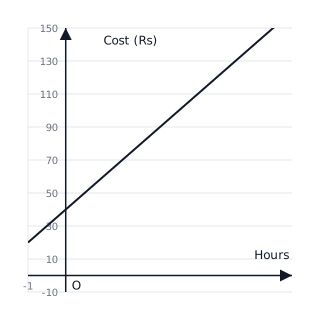
A plumber charges a fixed call-out fee plus an hourly rate. The graph of his total charges against time in hours is shown. Find the call-out fee and the hourly rate.
Solution:
- The call-out fee is the -intercept (where ). From the graph, at , . Call-out fee = Rs 40.
- The hourly rate is the gradient of the line.
- Take two points: and .
- .
- Hourly rate = Rs 20 per hour.
Explanation:
In practical cost graphs, the intercept on the vertical axis represents the fixed or initial cost, while the slope (gradient) represents the variable rate per unit of time or quantity.