
Review the key concepts, formulae, and examples before starting your quiz.
🔑Concepts
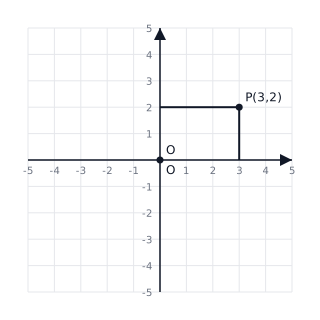
The Cartesian Coordinate System: A graph is formed by two perpendicular number lines. The horizontal line is the -axis, and the vertical line is the -axis. Their intersection point is the Origin . Any point is represented by an ordered pair , where is the abscissa and is the ordinate.
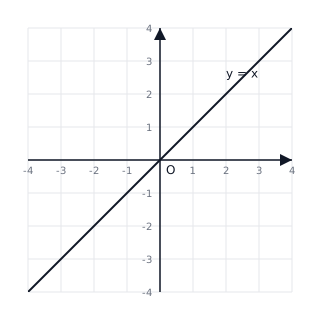
Linear Graphs: A graph that is a single straight line is called a linear graph. It represents a relationship where a change in one variable results in a proportional change in the other. Equations like result in lines passing through the origin.
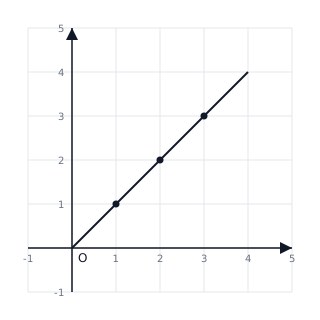
Plotting Points: To draw a linear graph, we first create a table of values by choosing independent values for and calculating the corresponding values. At least two points are needed to draw a unique straight line, though three are preferred for accuracy.
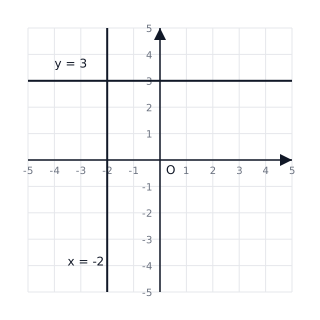
Horizontal and Vertical Lines: An equation of the form represents a vertical line parallel to the -axis. An equation of the form represents a horizontal line parallel to the -axis.
📐Formulae
General form of a linear equation:
Slope-intercept form:
Equation of the -axis:
Equation of the -axis:
Coordinates of the Origin:
💡Examples
Problem 1:
Draw a linear graph for the equation .
Solution:
- Create a table of values by choosing arbitrary values for :
- If , . Point is .
- If , . Point is .
- If , . Point is .
- Plot these three points , , and on the Cartesian plane.
- Using a ruler, draw a straight line passing through all these points.
- Label the line as .
Explanation:
To graph any linear equation, find at least two or three points that satisfy the equation, plot them, and join them with a straight line. Using three points ensures accuracy.
Problem 2:
Find the points where the line intersects the -axis and the -axis.
Solution:
-
To find the -intercept, set : The line intersects the -axis at .
-
To find the -intercept, set : The line intersects the -axis at .
Explanation:
Intersects are found by setting one coordinate to zero. The -intercept occurs when the vertical distance is zero, and the -intercept occurs when the horizontal distance is zero.
Problem 3:
A car travels at a constant speed of . Draw a distance-time graph for this motion and find the distance covered in hours.
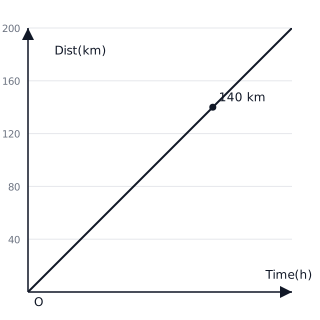
Solution:
- Let represent time in hours and represent distance in km.
- The relationship is given by Distance = Speed Time, so .
- Table of values:
- Plot the points and join them to the origin .
- For , the graph shows .
Explanation:
The distance-time graph for constant speed is always a straight line starting from the origin. The slope represents the speed of the car.
Problem 4:
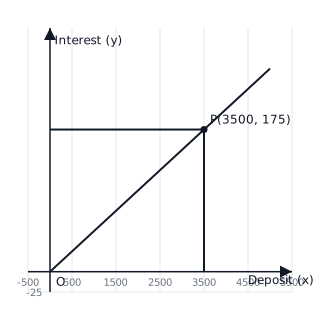
A bank offers simple interest per annum on deposits. Draw a graph to show the relation between the deposit amount () and the interest earned () in one year for deposits up to Rs . From the graph, find the interest for a deposit of Rs .
Solution:
-
Establish the Relation: The simple interest for one year is given by . Here, , , and is the deposit . So, or .
-
Generate Data Points:
- If ,
- If ,
- If ,
- If ,
- If ,
-
Plotting the Graph: Plot the points and join them with a straight line passing through the origin .
-
Finding Interest for Rs 3500: On the graph, locate on the x-axis. Move vertically to meet the line and then horizontally to the y-axis. The value on the y-axis is .
Final Answer: The interest for a deposit of Rs is Rs .
Explanation:
The relationship between principal and simple interest for a fixed rate and time is a direct proportion, resulting in a linear graph of the form . The constant of proportionality (slope) here is .