
Review the key concepts, formulae, and examples before starting your quiz.
🔑Concepts
A line graph consists of bits of line segments joined consecutively which displays data that changes continuously over periods of time. It uses a coordinate plane with a horizontal axis (-axis) and a vertical axis (-axis).
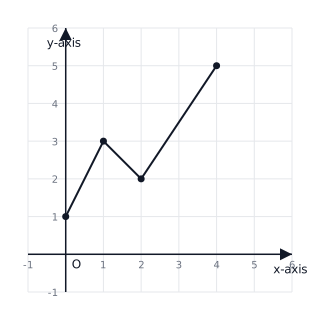
The -coordinate (abscissa) represents the independent variable (like time), and the -coordinate (ordinate) represents the dependent variable (like temperature or distance).
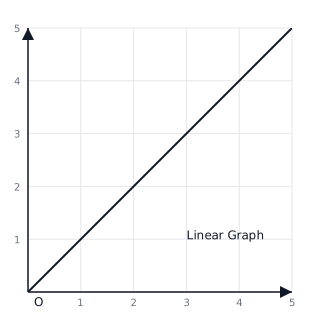
A 'Linear Graph' is a special case of a line graph where all the points lie on a single straight line, indicating a constant rate of change between variables.
A kink (zigzag line) is used on an axis if the data values do not start from zero, allowing for a clearer representation of the range where data actually exists.
📐Formulae
Coordinates of a point: where is the abscissa and is the ordinate.
General equation of a straight line (Linear Graph): , where is the slope and is the -intercept.
Slope () between two points and :
Midpoint Formula:
Distance between two points and :
💡Examples
Problem 1:
A car travels at a constant speed of . Create a distance-time table for hours and describe how to plot the resulting linear graph.
Solution:
Step 1: Create the table based on the formula .
- At . Point:
- At . Point:
- At . Point:
- At . Point:
Step 2: On a graph paper, take Time on the -axis () and Distance on the -axis (). Step 3: Plot the points and join them with a straight line.
Explanation:
Since the speed is constant, the relationship between distance and time is linear. The graph will be a straight line passing through the origin, showing that distance is directly proportional to time.
Problem 2:
The following coordinates represent the temperature recorded at different times of the day: . Find the increase in temperature between and .
Solution:
Step 1: Identify the -coordinates (temperatures) for the given times.
- Temperature at
- Temperature at
Step 2: Calculate the difference (increase).
Explanation:
By reading the -values corresponding to the specific points on the -axis (time), we can determine the change in the dependent variable (temperature) over the specified interval.
Problem 3:
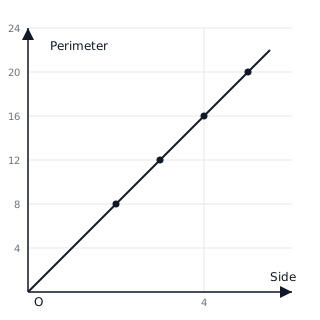
Plot a line graph for the following data showing the side of a square and its perimeter: Side (in cm): . Perimeter (in cm): . Determine if it is a linear graph.
Solution:
- Choose a scale: Let unit on -axis and unit on -axis .
- Plot points: .
- Join the points with line segments. Since all points lie on a single straight line, it is a linear graph.
Explanation:
Because the perimeter is related to side by , the ratio is constant, resulting in a straight line through the origin.
Problem 4:
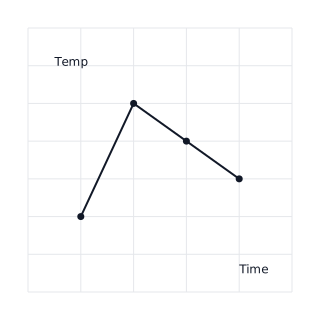
A patient's temperature was recorded every hour. Plot the data: .
Solution:
- Let -axis represent time (hours) and -axis represent temperature ().
- Plot .
- Connect points with straight line segments.
Explanation:
This graph shows the fluctuation of body temperature over time. It is a line graph but not a linear graph because the rate of change is not constant.