
Review the key concepts, formulae, and examples before starting your quiz.
🔑Concepts
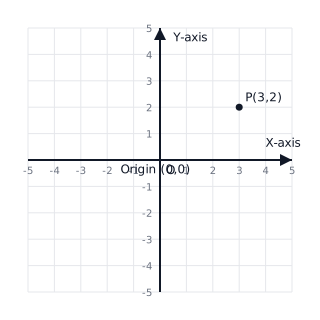
Graphs provide a visual representation of data, making it easier to see patterns and trends. The most fundamental system is the Cartesian coordinate system, which uses two perpendicular lines called axes: the horizontal -axis and the vertical -axis.
A line graph consists of segments joined together to show trends over time. When the graph is a single continuous straight line, it is called a linear graph.
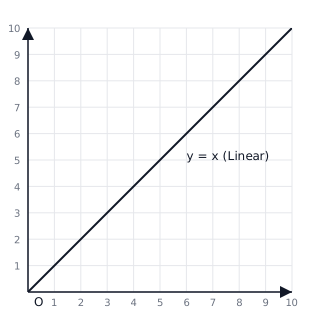
Reading a graph involves finding the value of one variable for a given value of another. For example, to find the -value at , move vertically from to the graph, then horizontally to the -axis.
Independent variables (the cause) are usually plotted on the horizontal -axis, while dependent variables (the effect) are plotted on the vertical -axis.
📐Formulae
Coordinate Point Representation:
Origin Coordinates:
General Equation of a Linear Graph:
Slope (Rate of Change):
Points on the -axis:
Points on the -axis:
💡Examples
Problem 1:
A bank gives Simple Interest on deposits. Draw a graph for the relationship between the sum deposited and the interest earned. From the graph, find the interest on a deposit of .
Solution:
- Let Deposit be and Interest be . The relation is .
- Create points: If ; if ; if .
- Plot points and join them to get a straight line passing through the origin.
- To find interest for , locate on the -axis, move vertically to meet the graph, then horizontally to the -axis.
- The -value corresponds to . So, interest = .
Explanation:
This is a linear graph problem where we use the coordinates to map the relationship between principal and interest. The graph allows us to interpolate values like that weren't in our initial data set.
Problem 2:
Identify the coordinates of a point which lies units to the left of the -axis and units below the -axis. Also, identify which quadrant it lies in.
Solution:
- '5 units to the left of the -axis' means the -coordinate is .
- '2 units below the -axis' means the -coordinate is .
- Combining these, the coordinates of point are .
- Since both and are negative, the point lies in the Third Quadrant.
Explanation:
To find coordinates, we translate directional descriptions into positive or negative values relative to the origin. Left and Down signify negative values in the Cartesian system.
Problem 3:
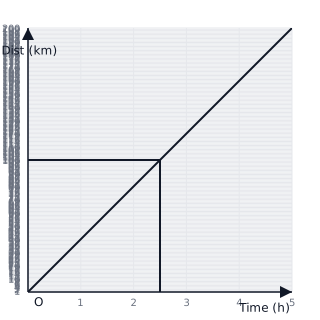
A car travels at a uniform speed of . Draw a distance-time graph for this motion and find the distance covered by the car in hours.
Solution:
- Create a table of values: Time (h) vs Distance (km). At ; At ; At .
- Plot the points and join them with a straight line.
- To find distance at hours, locate on the -axis, move up to the line, and read the -value. Distance = .
Explanation:
Since the speed is uniform, the distance is directly proportional to time (), resulting in a linear graph.
Problem 4:
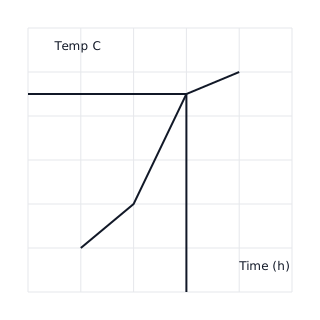
The following graph shows the temperature of a patient in a hospital, recorded every hour. At what time was the patient's temperature ?
Solution:
- Look at the -axis (Temperature) and find the mark for .
- Move horizontally from until you intersect the graph.
- From that point of intersection, move vertically down to the -axis (Time).
- The corresponding time on the -axis is .
Explanation:
To interpret a specific value, we use the intersection of horizontal and vertical projections from the axes to the plotted line.