
Review the key concepts, formulae, and examples before starting your quiz.
🔑Concepts
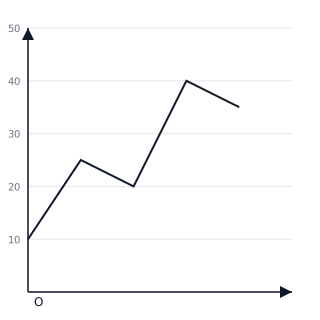
A line graph consists of bits of line segments joined consecutively which are used to show continuous data that changes over periods of time. For example, tracking temperature throughout a day.
A linear graph is a special case of a line graph where the plotted points form a single, straight line. It represents a constant rate of change between two variables, such as distance and time at a constant speed.
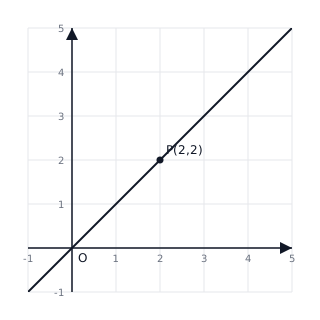
The location of a point on a graph is given by a pair of coordinates . The -coordinate (abscissa) tells the distance from the -axis, and the -coordinate (ordinate) tells the distance from the -axis.
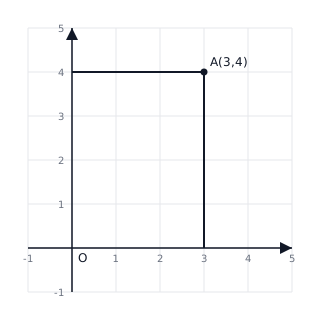
Independent variables (the cause) are typically plotted on the horizontal -axis, while dependent variables (the effect) are plotted on the vertical -axis. For example, when calculating cost based on quantity, quantity is on the -axis.
📐Formulae
Coordinates of a point:
Equation of the -axis:
Equation of the -axis:
General form of a linear equation:
Relationship for a square's perimeter: (where is the side length)
Simple Interest formula often used in graphs:
💡Examples
Problem 1:
Plot the points , , and on a graph. If you join them to form a triangle, find the length of the base .
Solution:
Step 1: Locate by moving units right and units up. Step 2: Locate by moving units right and units up. Step 3: Locate by moving units right and units up. Step 4: Join to , to , and to . Step 5: Since and have the same -coordinate, the distance is the difference in their -coordinates: units.
Explanation:
This problem demonstrates how to plot points and calculate horizontal distance between points sharing the same -level (ordinate).
Problem 2:
A bank gives Simple Interest on deposits. Draw a graph for the interest earned on deposits of . Use the graph to find the interest on .
Solution:
Step 1: Calculate interest values: For ; for ; for . Step 2: Plot points where is deposit and is interest. Step 3: Join the points with a straight line passing through . Step 4: To find interest for , look at on the -axis, move vertically to the line, then horizontally to the -axis. The value is .
Explanation:
This is a linear graph example where the relationship between deposit and interest is proportional, resulting in a straight line through the origin.
Problem 3:
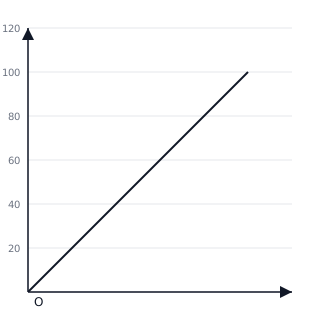
The following table shows the cost of different quantities of apples. Draw a graph for the data: Quantity (kg): Cost (Rs): . Is this a linear graph?
Solution:
- Plot the points on a Cartesian plane.
- Connect the points with a line.
- Since all the points lie on a single straight line passing through the origin, this is a linear graph.
Explanation:
A linear relationship exists because the cost increases by a fixed amount (Rs 20) for every 1 kg increase in quantity. The equation is .
Problem 4:
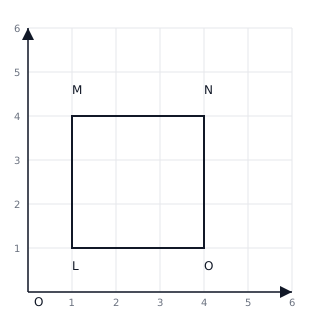
Plot the points , , , and on a graph. Join the points in order. What shape is formed? Find its area.
Solution:
- Plot points .
- Joining them in order forms a square.
- Side length = units.
- Area = square units.
Explanation:
The coordinates form a closed figure where all sides are equal ( units) and all angles are , confirming it is a square.