
Review the key concepts, formulae, and examples before starting your quiz.
🔑Concepts
A distance-time graph illustrates how far an object has traveled over a period of time. In these graphs, time is plotted on the horizontal x-axis and distance from a starting point is plotted on the vertical y-axis. A horizontal line segment indicates that the object is stationary (distance is not changing).
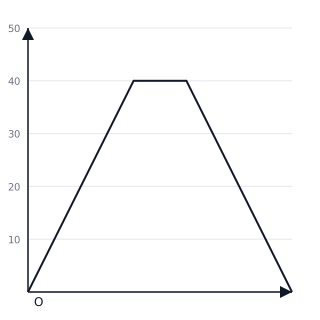
The gradient (slope) of a distance-time graph represents the speed of the object. A steeper line indicates a higher speed, while a gentler slope indicates a slower speed. The gradient can be calculated using .
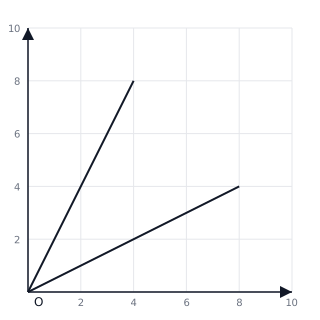
Conversion graphs are straight-line graphs used to convert one unit of measurement to another (e.g., Celsius to Fahrenheit or Pounds to Kilograms). If the conversion is directly proportional, the line will pass through the origin .
To read a conversion graph, find the given value on one axis, move vertically or horizontally to meet the line, and then move to the other axis to find the corresponding converted value.
📐Formulae
💡Examples
Problem 1:
A cyclist travels at a constant speed for and covers a distance of . He then rests for and finally travels back to the start point in at a constant speed. Calculate the speed for the first part of the journey and the speed for the return journey.
Solution:
For the first part: . For the return journey: .
Explanation:
In the first part, the cyclist covers in . During the rest period, the distance remains constant at (horizontal line). On the return journey, the cyclist covers the same back to the start () in .
Problem 2:
A conversion graph for miles and kilometers passes through the origin and the point , where is miles and is kilometers. Use this relationship to convert to kilometers.
Solution:
Given the ratio , for :
Explanation:
Since the graph is a straight line through the origin, the units are directly proportional. We find the scale factor by dividing the target value by the known value () and then multiply the corresponding kilometer value by that scale factor.
Problem 3:
A car travels in . Calculate its average speed.
Solution:
Explanation:
Divide the total distance by the total time taken to find the average speed. If the graph of this journey was a straight line, would be the constant gradient of that line.
Problem 4:
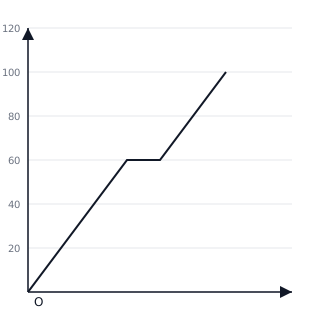
A car's journey is recorded on the distance-time graph below. The car travels in , stops for , and then continues another in . Calculate the speed for the first part of the journey and the average speed for the entire trip.
Solution:
-
Speed for the first part:
-
Average speed for the whole trip:
Explanation:
Speed is the gradient of the distance-time graph. Average speed considers the total distance divided by the total time, including the time spent stationary.
Problem 5:
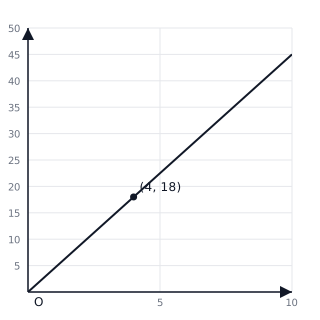
The conversion graph below shows the relationship between Gallons and Liters. Use the graph to convert to Liters. Then, determine how many Gallons are approximately equal to by using the same ratio.
Solution:
-
From the graph, find on the Gallons (x-axis). Move up to the line and then left to the Liters (y-axis). The value is .
-
To find the ratio:
-
To convert to Gallons:
Explanation:
Conversion graphs represent linear relationships. By finding the value on one axis, we can map it to the other. Alternatively, we can find the unit rate (gradient) to solve via calculation.