
Review the key concepts, formulae, and examples before starting your quiz.
🔑Concepts
A dot plot is a simple statistical chart where data points are represented by dots (or Xs) placed above a number line. It shows the frequency of each data value visually.
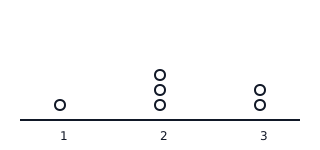
The Mode is easily identified on a dot plot as the value with the tallest stack of dots. It represents the most common value in the dataset.
The Range is the difference between the maximum and minimum values on the number line that actually have dots above them:
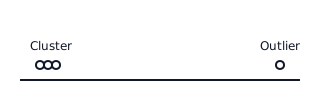
An Outlier is a data point that is much higher or much lower than the rest of the data. On a dot plot, it appears as a lone dot far away from the main cluster of dots.
The Median is the middle dot. If there are total dots, count from either end to find the position.
📐Formulae
💡Examples
Problem 1:
A group of students were asked how many hours they spend reading each week. The data collected was: . Create a frequency table and find the Mode and Range.
Solution:
- Organize data: The value appears times, appears times, appears time, and appears time.
- Mode: The value with the highest frequency is (it appears times).
- Range: .
Explanation:
In a dot plot, the value would have a stack of dots, which is the tallest, making it the mode. The range is the spread from the smallest value () to the largest ().
Problem 2:
A dot plot shows the following number of goals scored by a soccer team in games: Two dots over , two dots over , and one dot over . Calculate the Mean number of goals.
Solution:
- List the values: .
- Find the sum: .
- Count the dots (): .
- Calculate Mean: .
Explanation:
To find the mean from a dot plot, you must account for every dot. We sum the value of each dot and divide by the total count of dots ().
Problem 3:
Identify if there is an outlier in this dataset represented on a number line: dots at and one single dot at .
Solution:
The value is the outlier.
Explanation:
An outlier is a value that lies an abnormal distance from other values. Here, most data points cluster between and , while is significantly further away.
Problem 4:
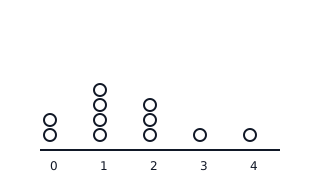
The following dot plot shows the number of siblings reported by a group of students. Calculate the Range and the Median for this data.
Solution:
- Range: The highest value with a dot is and the lowest is .
- Total Dots: Count the dots: dots.
- Median: The middle position is the dot. Counting from zero: the and dots are at ; the dots are at . Therefore, the Median is .
Explanation:
The range tells us the spread of the data, while the median gives us the center of the dataset by identifying the middle value in the ordered sequence.
Problem 5:
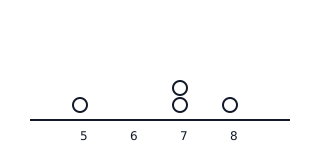
Determine the Mean (average) number of points scored in a quiz based on the provided dot plot.
Solution:
- Identify Values: The dots are at (one dot), (two dots), and (one dot).
- Sum of Values:
- Number of Data Points:
- Calculate Mean:
Explanation:
To find the mean, you sum the numeric value of every dot shown and divide by the total count of dots.