
Review the key concepts, formulae, and examples before starting your quiz.
🔑Concepts
A pictograph is a way of representing data using pictures or icons, where each icon stands for a specific quantity called the 'Scale' or 'Key'.
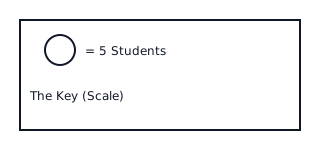
When a quantity is not a perfect multiple of the scale, partial symbols (like half an icon) are used to represent smaller values. For example, if icon represents units, then half an icon represents units.
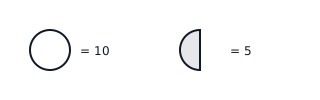
To interpret a pictograph, we multiply the number of symbols for a category by the value of the key. Total value = (Full symbols Key) + (Partial symbols Fraction of Key).
To draw a pictograph, we decide on a suitable scale that can represent all data points clearly without drawing too many symbols. We then divide the data value by the scale to find the number of icons needed.
📐Formulae
💡Examples
Problem 1:
A pictograph shows the number of cars sold by a showroom in four months. The key is . In May, there are full car icons and half-car icon. How many cars were sold in May?
Solution:
Step 1: Identify the value of one full icon from the key, which is . Step 2: Calculate the value of the half-car icon: . Step 3: Multiply the number of full icons by the scale: . Step 4: Add the value of the half icon to the total: .
Explanation:
To find the total value, we interpret the full symbols first and then add the fractional part represented by the partial symbol based on the given scale.
Problem 2:
A gardener planted Rose plants, Lily plants, and Jasmine plants. If we want to represent this data in a pictograph using the scale , how many icons should be drawn for each type?
Solution:
Step 1: For Roses, divide the total by the scale: . This means full icons and half icon. Step 2: For Lilies, divide the total by the scale: full icons. Step 3: For Jasmine, divide the total by the scale: . This means full icons and half icon.
Explanation:
To determine the number of icons needed, we divide the actual data value by the value assigned to one symbol in the key. Fractional results are represented by partial icons.
Problem 3:
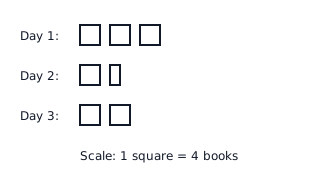
The following table shows the number of books read by students in a library over three days. Draw a pictograph using the scale . Day 1: books Day 2: books Day 3: books
Solution:
- Calculate symbols for Day 1: squares.
- Calculate symbols for Day 2: full square and half square (since is half of ).
- Calculate symbols for Day 3: squares.
Explanation:
We use the scale square books. For Day 2, since is not a multiple of , we use full square () and half a square () to total .
Problem 4:
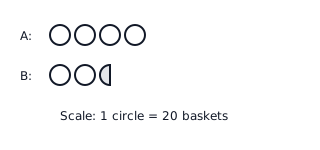
Look at the pictograph representing the number of fruit baskets sold by a merchant. If , find the difference in the number of baskets sold between Merchant A and Merchant B.
Solution:
- Merchant A has full circles. Total baskets.
- Merchant B has full circles and half circle. Total baskets.
- Difference baskets.
Explanation:
Identify the number of icons for each person. Multiply by the scale factor of . Subtract the values to find the difference.