
Review the key concepts, formulae, and examples before starting your quiz.
🔑Concepts
A bar graph is a pictorial representation of numerical data using bars of uniform width drawn horizontally or vertically with equal spacing between them. The length of each bar represents the frequency or value of the observation.
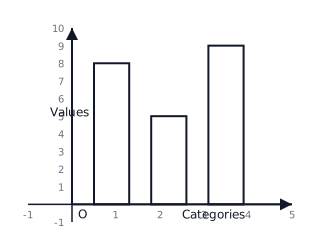
Choosing a scale is crucial for drawing an accurate bar graph. A scale is the ratio between the unit length of the bar and the actual value it represents. For example, means a bar of units length represents a value of .
The width of the bars must be uniform across the graph, and the gap between any two consecutive bars must remain constant to ensure clear comparison.
Every bar graph must have a Title explaining what the data represents, and both the horizontal (X-axis) and vertical (Y-axis) should be clearly labeled with the scale mentioned.
📐Formulae
💡Examples
Problem 1:
The following data shows the number of bicycles sold by a shop in four days: Monday: 35, Tuesday: 20, Wednesday: 25, Thursday: 30. Draw a bar graph for this data using a scale of .
Solution:
Step 1: Choose the scale, which is . Step 2: Calculate the height of the bars for each day:
- Monday:
- Tuesday:
- Wednesday:
- Thursday: Step 3: Draw two perpendicular axes. Mark 'Days' on the X-axis and 'Number of Bicycles' on the Y-axis. Step 4: Draw bars of equal width with heights units respectively, keeping equal gaps between them.
Explanation:
To represent the data accurately, we divide each data value by the scale factor to find the physical height of the bars. This ensures the proportions are maintained correctly on the graph paper.
Problem 2:
A student spends time on various activities in a day: Study (6 hours), Play (2 hours), Sleep (8 hours), Others (8 hours). If we represent this on a bar graph with a scale of , what will be the heights of the bars?
Solution:
Given scale: . Heights of bars:
- Study:
- Play:
- Sleep:
- Others:
Explanation:
Each activity's duration is divided by the value of one unit ( hours) to determine how many units high each bar should be drawn on the Y-axis.
Problem 3:
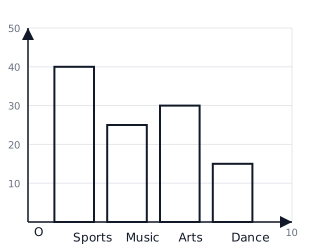
The number of students in different clubs of a school are: Sports (40), Music (25), Arts (30), and Dance (15). Draw a bar graph representing this data using a scale of .
Solution:
- Identify the categories for the horizontal axis: Sports, Music, Arts, Dance.
- Determine the bar heights based on the scale :
- Sports:
- Music:
- Arts:
- Dance:
- Draw the bars with equal width and equal spacing on the graph.
Explanation:
By using a scale of , we convert large numbers into manageable unit lengths. For example, the Sports bar is the tallest at units because .
Problem 4:
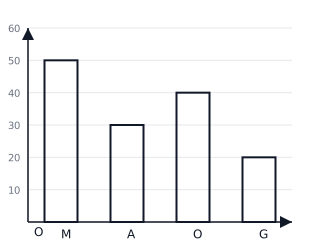
A fruit seller sold the following quantities of fruits in a day: Mango (50 kg), Apple (30 kg), Orange (40 kg), and Grapes (20 kg). Draw a bar graph for this data using a scale of .
Solution:
- Categories: Mango, Apple, Orange, Grapes.
- Bar heights calculation ():
- Mango:
- Apple:
- Orange:
- Grapes:
Explanation:
Each unit on the vertical axis represents . The Mango bar reaches the unit line, representing , which is the highest quantity sold.