
Review the key concepts, formulae, and examples before starting your quiz.
🔑Concepts
A pictograph represents data through pictures or symbols of objects. It helps us understand a large amount of information at a single glance.
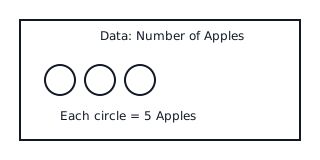
The 'Scale' or 'Key' is the most important part of a pictograph. It defines how many units one single symbol represents. For example, if star symbol represents stars, then stars represent stars.
To find the total quantity for a category, multiply the number of symbols shown by the value given in the scale:
Sometimes, a partial symbol is used to represent a value less than the full scale. For example, if a full circle represents , a semi-circle might represent .
📐Formulae
💡Examples
Problem 1:
In a village, the number of tractors owned by farmers is shown using pictographs. If symbol of a tractor represents tractors, and Farmer Ramu has symbols next to his name, how many tractors does he own?
Solution:
Farmer Ramu owns tractors.
Explanation:
Given that symbol = tractors. Since Ramu has symbols, the calculation is:
Problem 2:
A shopkeeper sold shirts on Tuesday. If he uses a scale where symbol represents shirts, how many symbols should he draw in the pictograph for Tuesday?
Solution:
The shopkeeper should draw symbols.
Explanation:
To find the number of symbols, we divide the total quantity by the value of one symbol: So, symbols are required.
Problem 3:
The following symbols represent the number of students who like different fruits. If symbol students, find the difference between students who like Mango ( symbols) and students who like Apple ( symbols).
Solution:
The difference is students.
Explanation:
Number of students who like Mango = . Number of students who like Apple = . Difference: Alternatively, difference in symbols = symbols. Value = .
Problem 4:
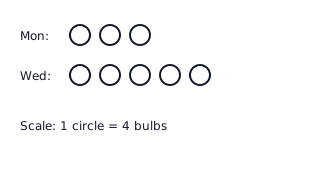
The following pictograph shows the number of electric bulbs sold by a shopkeeper on four different days. If each symbol represents bulbs, find the total number of bulbs sold on Monday and Wednesday combined.
Solution:
- Identify the symbols for Monday: symbols.
- Calculate bulbs for Monday: bulbs.
- Identify the symbols for Wednesday: symbols.
- Calculate bulbs for Wednesday: bulbs.
- Total bulbs = bulbs.
Explanation:
We use the scale symbol units. By counting the symbols for each day and multiplying by , we get the actual counts, which are then added together.
Problem 5:
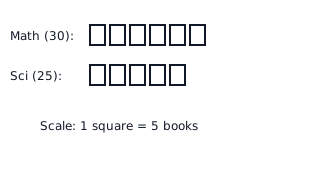
A class library has books of different subjects. The number of Math books is and Science books is . If we use a symbol to represent books, how many symbols must be drawn for Math and Science respectively?
Solution:
- For Math: Number of symbols = symbols.
- For Science: Number of symbols = symbols.
Explanation:
To find the number of symbols needed, we divide the total quantity by the value of one symbol (the scale).