
Review the key concepts, formulae, and examples before starting your quiz.
🔑Concepts
A bar graph is a pictorial representation of numerical data using rectangular bars (columns) of equal width, where the length (or height) of each bar is proportional to the value it represents.
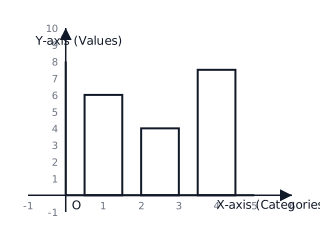
The 'Scale' of a bar graph is a chosen ratio that relates the length of the bar to the actual numerical value. For example, unit length = units of data.
The width of the bars should be kept uniform (the same) for all categories, and the spacing between any two consecutive bars should also be equal.
The title of the bar graph explains what information is being presented, and the axes should be clearly labeled to indicate the categories and the frequency/values.
📐Formulae
💡Examples
Problem 1:
The number of marks obtained by Rohan in five subjects are: Hindi: , English: , Maths: , Science: , and S.St: . If we choose a scale of unit length = marks, find the length of the bar for Maths.
Solution:
Marks in Maths = . Scale = unit length = marks. Length of the bar for Maths = units.
Explanation:
To find the length of the bar, we divide the actual value of the data by the value assigned to one unit of the scale.
Problem 2:
In a bar graph, the bar representing the number of bicycles sold in a shop is units long. If the scale is unit length = bicycles, calculate the total number of bicycles sold.
Solution:
Length of the bar = units. Scale = unit = bicycles. Total bicycles sold = .
Explanation:
The total value is calculated by multiplying the number of units shown on the graph by the value of each unit.
Problem 3:
The following are the number of electric bulbs purchased for a lodging house during the first four months of a year: January (), February (), March (), April (). If we want to represent this data on a bar graph, what would be an appropriate scale?
Solution:
The data values are . Since all values are even and range between and , an appropriate scale could be unit length = bulbs or unit length = bulbs.
Explanation:
A scale is chosen based on the range of the data so that the bars are neither too long nor too short to fit on the graph paper.
Problem 4:
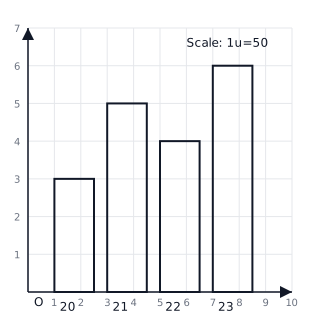
The number of trees planted by a school in four consecutive years is given: 2020 ( trees), 2021 ( trees), 2022 ( trees), and 2023 ( trees). If a scale of unit = trees is used, calculate the height of the bars for each year and draw the representation.
Solution:
- Given scale: .
- For 2020: .
- For 2021: .
- For 2022: .
- For 2023: .
Explanation:
To find the length of the bar, we divide the actual value by the scale value. Here, dividing each year's total by gives us the corresponding height in units for the graph.
Problem 5:
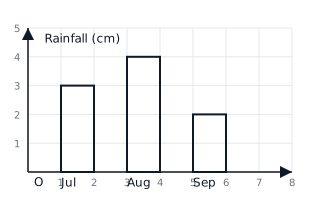
Observe the following bar graph which shows the amount of rainfall (in cm) in a city over 3 months: July ( cm), August ( cm), and September ( cm). If the scale is , what is the total rainfall recorded over the three months?
Solution:
Using scale units: July: August: September:
Explanation:
The total rainfall is the sum of the individual values represented by the bars. We calculate each value by multiplying the unit height of the bar by the scale factor.