
Review the key concepts, formulae, and examples before starting your quiz.
🔑Concepts
A bar graph is a visual representation of data using rectangular bars of uniform width. The lengths or heights of these bars are proportional to the values they represent.
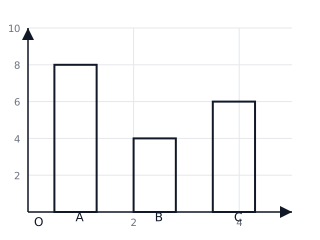
The scale is the most important part of a bar graph. It defines how many units of data are represented by one unit of length on the axis. For example, .
All bars in a bar graph must have the same width, and the spacing between any two consecutive bars must be equal.
The axes must be clearly labeled. Usually, the horizontal axis (x-axis) represents the categories, and the vertical axis (y-axis) represents the numerical values or frequencies.
📐Formulae
💡Examples
Problem 1:
The following table shows the number of bicycles sold by a shop in four different months: July (), August (), September (), and October (). Choose a suitable scale and determine the heights of the bars for a vertical bar graph.
Solution:
- Let us choose a scale: .
- Calculate the height for each month:
- July:
- August:
- September:
- October:
Explanation:
To determine the height of the bars, we divide the actual data value by the chosen scale. Since the highest value is , a scale of makes the graph compact and easy to read.
Problem 2:
In a bar graph where the scale is , if the bar representing 'Grade 6' has a height of units, how many students are there in Grade 6?
Solution:
Given:
- Scale:
- Height of the bar
Explanation:
By multiplying the number of units shown on the graph by the value of a single unit defined in the scale, we obtain the actual quantity.
Problem 3:
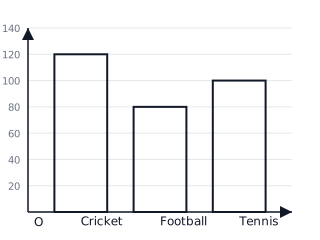
The following data shows the favorite sports of students: Cricket (), Football (), and Tennis (). Represent this data on a bar graph by choosing a scale of .
Solution:
- Identify the values: Cricket = , Football = , Tennis = .
- Calculate bar heights using the scale :
- Cricket: units
- Football: units
- Tennis: units
- Draw the bars with heights , , and respectively.
Explanation:
By dividing each value by the scale factor of , we find the height in units required for each bar on the graph paper.
Problem 4:
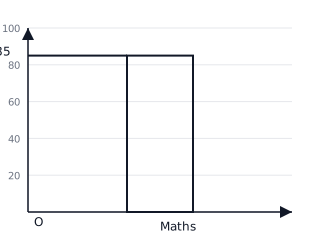
Observe the bar graph which shows the marks obtained by a student in different subjects. Find the marks in Mathematics if the scale is and the bar height for Mathematics is units.
Solution:
The student obtained marks in Mathematics.
Explanation:
To find the actual data value from a graph, multiply the measured height of the bar by the value assigned to one unit length in the scale.