
Review the key concepts, formulae, and examples before starting your quiz.
🔑Concepts
Bivariate data involves the relationship between two variables, typically plotted as coordinates on a scatter graph to identify patterns or trends.
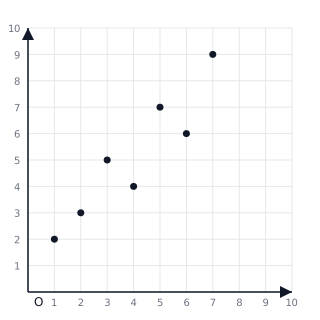
Correlation describes the strength and direction of the relationship: Positive correlation (both variables increase together), Negative correlation (one increases as the other decreases), or No correlation (no discernible pattern).
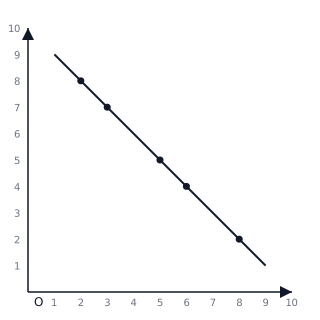
The Line of Best Fit (Trend Line) is a straight line that passes through the 'middle' of the points. It must pass through the Mean Point . It is used for Interpolation (predicting within the data range) and Extrapolation (predicting outside the data range).
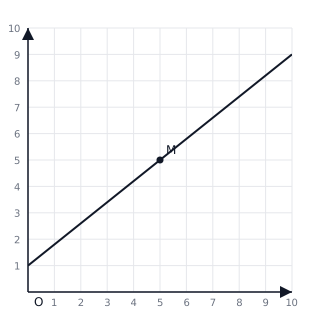
Outliers are data points that lie significantly far away from the general trend of the other points. They can affect the position of the line of best fit.
📐Formulae
💡Examples
Problem 1:
A student records the number of hours spent studying () and the test scores () for 5 students: . Calculate the mean point for this data.
Solution:
The mean point is .
Explanation:
To find the mean point, calculate the arithmetic mean of all -coordinates and all -coordinates separately.
Problem 2:
Given a line of best fit equation where is the number of hours worked and is the total earnings. Predict the earnings for someone working hours.
Solution:
Substitute into the equation: The predicted earnings are .
Explanation:
Interpolation involves substituting a known independent variable value into the linear equation derived from the scatter graph.
Problem 3:
Determine the type of correlation for the following data points: .
Solution:
As increases (), the values of decrease (). Therefore, the data shows a strong negative correlation.
Explanation:
Correlation is identified by observing the direction in which moves as increases. Since decreases as increases, the gradient of the relationship is negative.
Problem 4:
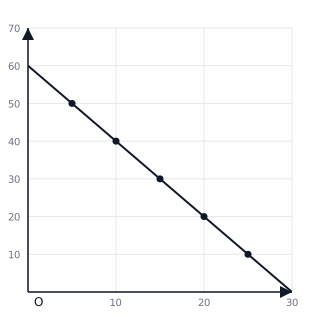
A researcher investigates the relationship between the outside temperature () and the number of hot drinks sold . The data collected is: . Plot the data and determine the equation of the line of best fit if it passes through and .
Solution:
Explanation:
The points show a perfect negative linear correlation. Using the coordinates provided for the line of best fit, we calculate the gradient and the y-intercept to form the linear equation.
Problem 5:
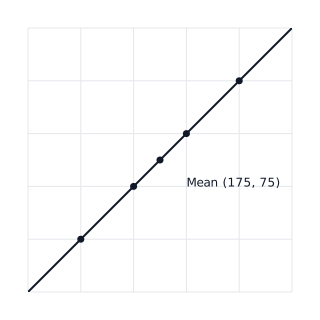
Calculate the mean point for the following heights ( in cm) and weights ( in kg) of four athletes: . Use this to verify if the line is a valid line of best fit.
Solution:
Explanation:
The mean point is calculated by averaging the and values separately. Since the mean point satisfies the equation , it is a valid candidate for the line of best fit.