
Statistics and Probability - Representation of data: frequency tables, histograms, and cumulative frequency graphs
Review the key concepts, formulae, and examples before starting your quiz.
🔑Concepts
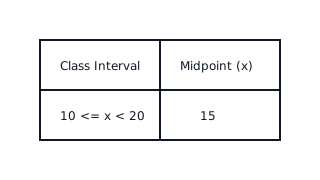
Frequency tables and the midpoint method: When data is grouped into classes like , the midpoint is used as a representative value to estimate the mean using .
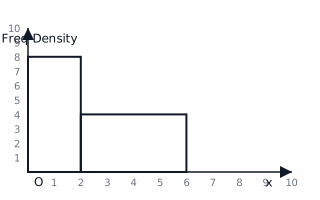
Histograms use Frequency Density on the y-axis: The area of the bar represents the frequency. This is essential when class widths are unequal. .
Cumulative Frequency Graphs: Data is plotted at the upper bound of each class. The graph is an 'S-curve' used to estimate the median ( mark) and the Interquartile Range (IQR).
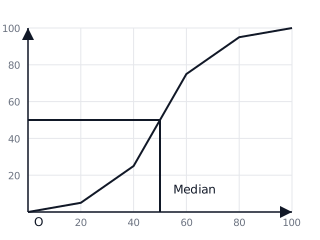
Interquartile Range (IQR): This represents the middle of the data. , where is the lower quartile ( position) and is the upper quartile ( position).
📐Formulae
💡Examples
Problem 1:
Calculate the estimated mean for the following frequency table of test scores:
- : Frequency
- : Frequency
- : Frequency
Solution:
-
Find midpoints () for each class:
- Class 1:
- Class 2:
- Class 3:
-
Calculate for each class:
-
Sum the frequencies ():
-
Sum the values ():
-
Calculate Mean:
Explanation:
To estimate the mean from grouped data, we assume every value in an interval is equal to the midpoint of that interval. We then multiply these midpoints by their respective frequencies and divide by the total number of observations.
Problem 2:
A cumulative frequency graph for students' heights starts at and ends at . If the curve passes through the point , what percentage of students are taller than cm?
Solution:
- Identify total number of students (): .
- Identify students with height cm: The -value at is . This means students are cm or shorter.
- Calculate students taller than cm: .
- Calculate as a percentage: .
Explanation:
Cumulative frequency graphs always show the number of data points 'less than or equal to' a specific value. To find the number of values 'greater than', subtract the -value from the total frequency.
Problem 3:
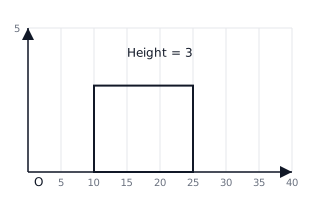
A histogram is drawn for the distribution of the masses of parcels. One bar has a class interval of and a frequency of . Calculate the frequency density for this bar.
Solution:
Explanation:
To find the frequency density, we first determine the width of the class interval and then divide the frequency by that width. In a histogram, the height of the bar corresponds to this density.
Problem 4:
From the cumulative frequency curve provided, estimate the Interquartile Range (IQR) if occurs at and occurs at .
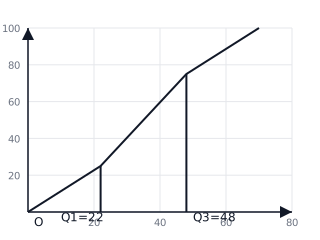
Solution:
Explanation:
The IQR is the difference between the upper quartile and the lower quartile values on the x-axis (the data values, not the frequencies).