
Review the key concepts, formulae, and examples before starting your quiz.
🔑Concepts
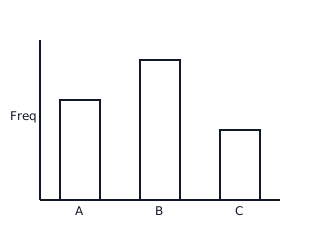
Bar charts are used to compare discrete categories. The height of each bar represents the frequency of that category, and all bars must have equal width with gaps between them.
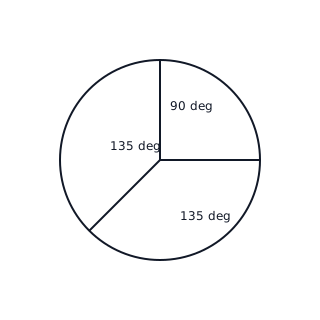
Pie charts represent parts of a whole. Each sector's angle is proportional to the frequency it represents relative to the total, calculated as .
Histograms are for continuous data. Unlike bar charts, the area (not just height) represents the frequency. This is critical when class widths are unequal.
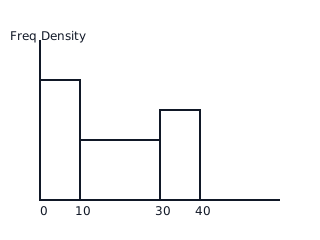
Frequency Density is calculated as . This value is plotted on the vertical axis of a histogram.
📐Formulae
💡Examples
Problem 1:
In a survey of 60 students, 15 students chose 'Basketball' as their favorite sport. Calculate the angle for the 'Basketball' sector in a pie chart.
Solution:
Explanation:
To find the angle, divide the frequency of the category by the total frequency and multiply by 360. .
Problem 2:
A histogram is drawn to represent the weights of packages. For the class interval , the frequency is 45. Calculate the frequency density for this bar.
Solution:
Explanation:
First, find the class width: . Then apply the formula: .
Problem 3:
On a histogram, a bar has a width of 5 units (from to ) and a frequency density of 1.2. What is the frequency represented by this bar?
Solution:
Explanation:
Frequency is calculated as the area of the bar in a histogram. .
Problem 4:
A group of 120 people were asked about their favorite fruit. 40 chose Apple, 50 chose Banana, and 30 chose Orange. Construct the sector angles for a pie chart.
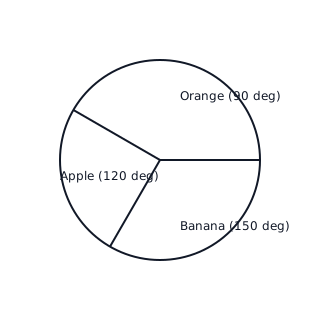
Solution:
Explanation:
To find the angle for each fruit, divide the frequency of that fruit by the total number of people surveyed and then multiply by the total degrees in a circle ().
Problem 5:
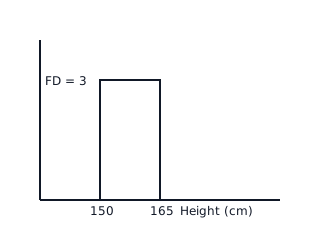
The table below shows the distribution of heights ( cm) of students. For the interval , the frequency is 45. Find the height of the bar on a histogram if the vertical axis represents frequency density.
Solution:
Explanation:
The class width is the range of the interval. The frequency density, which is the height of the bar on a histogram, is the frequency divided by this width.