
Linear Equations in Two Variables - Plot and interpret graphs of linear equations on the Cartesian plane
Review the key concepts, formulae, and examples before starting your quiz.
🔑Concepts
A linear equation in two variables is represented geometrically as a straight line on the Cartesian plane. Every point that satisfies the equation lies on this line, and every point on the line is a solution to the equation.
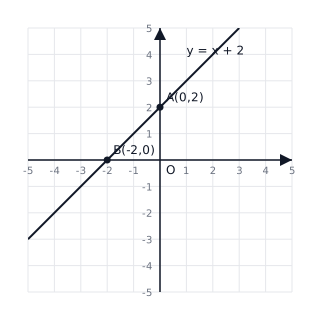
To plot the graph, we typically find at least two solutions (ordered pairs) of the equation. For example, by setting we find the -intercept, and by setting we find the -intercept. Connecting these points with a straight line defines the graph.
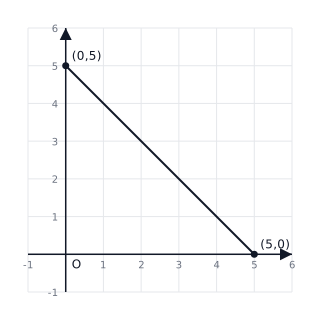
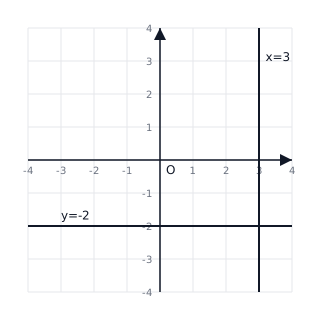
Equations of the form represent vertical lines parallel to the -axis, while equations of the form represent horizontal lines parallel to the -axis.
The graph of always passes through the origin . This represents a direct variation between and .
📐Formulae
Standard Form:
Slope-Intercept Form:
Isolated variable form for calculation:
Equation of -axis:
Equation of -axis:
💡Examples
Problem 1:
Find three different solutions for the equation .
Solution:
Step 1: Let . Substituting into the equation: . So, is a solution. \nStep 2: Let . Substituting into the equation: . So, is a solution. \nStep 3: Let . Substituting into the equation: . So, is a solution.
Explanation:
To find solutions, we arbitrarily chose values for one variable and solved for the other. Each pair represents a point on the graph of the line .
Problem 2:
Check if the point is a solution to the equation .
Solution:
Step 1: Identify the coordinates and . \nStep 2: Substitute these values into the LHS of the equation: . \nStep 3: Simplify the expression: . \nStep 4: Compare LHS and RHS. Since and , .
Explanation:
Because the substitution makes the equation true, the ordered pair is a solution, meaning this point lies exactly on the line .
Problem 3:
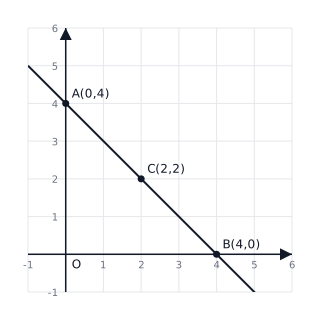
Draw the graph of the linear equation .
Solution:
- Find solutions: If , . Point is . If , . Point is . If , . Point is .
- Plot these points , , and on the graph.
- Draw a line passing through these points.
Explanation:
To graph a linear equation, we find coordinate pairs that make the equation true. The intercepts (where the line crosses the axes) are usually the easiest points to calculate.
Problem 4:
Draw the graph of the linear equation . Find the coordinates of the point where the graph cuts the -axis.
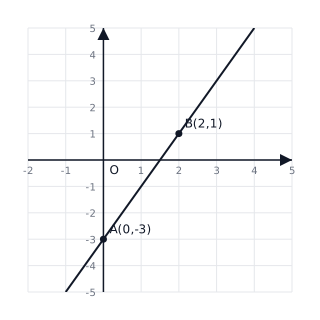
Solution:
Step 1: Express in terms of : . Step 2: Find at least two solutions. If , . Point is . If , . Point is . Step 3: Plot points and on the Cartesian plane and join them with a straight line. Step 4: Observation: The line cuts the -axis at .
Explanation:
To plot the graph, we calculate coordinates that satisfy the equation. The -axis intersection occurs where the -coordinate is zero.