
krit.club logo

Data Handling - Circle Graph or Pie Chart

Grade 8ICSE

Review the key concepts, formulae, and examples before starting your quiz.

🔑Concepts

•

A Pie Chart (or Circle Graph) represents data as sectors of a circle where the entire circle represents the total value (100%100\% or 360∘360^{\circ}), and each sector shows the relative size of a specific category.
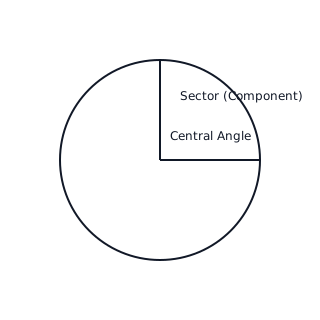
A circle showing a sector representing a data component with a central angle at the center.
•

The sum of all central angles in a pie chart is always 360∘360^{\circ}. The size of each angle is proportional to the value of the component it represents.
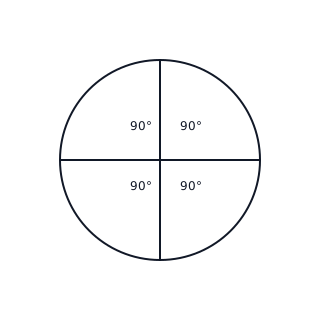
Circle divided into four 90 degree sectors summing to 360 degrees.
•

To convert data values into central angles, use the ratio of the component value to the total sum, multiplied by 360∘360^{\circ}.

•

Pie charts are particularly useful for showing the 'part-to-whole' relationship, such as how a budget is distributed or the composition of a library's book collection.

📐Formulae

Central Angle of a Component=(Value of the ComponentTotal Value)×360∘\text{Central Angle of a Component} = \left( \frac{\text{Value of the Component}}{\text{Total Value}} \right) \times 360^{\circ}

Central Angle (from Percentage)=(Percentage Value100)×360∘\text{Central Angle (from Percentage)} = \left( \frac{\text{Percentage Value}}{100} \right) \times 360^{\circ}

Value of a Component=Central Angle360∘×Total Value\text{Value of a Component} = \frac{\text{Central Angle}}{360^{\circ}} \times \text{Total Value}

Percentage of a Component=Central Angle360∘×100\text{Percentage of a Component} = \frac{\text{Central Angle}}{360^{\circ}} \times 100

💡Examples

Problem 1:

In a survey of 7272 students, 1818 chose Blue as their favorite color, 2424 chose Red, and 3030 chose Green. Calculate the central angles for each color to represent this data on a pie chart.

Solution:

  1. Calculate the total number of students: 18+24+30=7218 + 24 + 30 = 72.
  2. Find the Central Angle for Blue: 1872×360∘=14×360∘=90∘\frac{18}{72} \times 360^{\circ} = \frac{1}{4} \times 360^{\circ} = 90^{\circ}.
  3. Find the Central Angle for Red: 2472×360∘=13×360∘=120∘\frac{24}{72} \times 360^{\circ} = \frac{1}{3} \times 360^{\circ} = 120^{\circ}.
  4. Find the Central Angle for Green: 3072×360∘=512×360∘=5×30∘=150∘\frac{30}{72} \times 360^{\circ} = \frac{5}{12} \times 360^{\circ} = 5 \times 30^{\circ} = 150^{\circ}.
  5. Verify the sum: 90∘+120∘+150∘=360∘90^{\circ} + 120^{\circ} + 150^{\circ} = 360^{\circ}.

Explanation:

To find the central angle, we divide the frequency of each color by the total frequency (7272) and multiply by 360∘360^{\circ}. The sum must equal 360∘360^{\circ} to ensure the entire circle is covered.

Problem 2:

A pie chart representing a family's budget shows a central angle of 108∘108^{\circ} for 'Food'. If the total monthly income is ₹45,000₹ 45,000, calculate the amount spent on food and the percentage of income it represents.

Solution:

  1. Calculate the amount spent on food: Amount=108∘360∘×45,000\text{Amount} = \frac{108^{\circ}}{360^{\circ}} \times 45,000.
  2. Simplify the fraction: 108360=310\frac{108}{360} = \frac{3}{10}.
  3. Final amount: 310×45,000=3×4,500=₹13,500\frac{3}{10} \times 45,000 = 3 \times 4,500 = ₹ 13,500.
  4. Calculate the percentage: Percentage=108∘360∘×100=310×100=30%\text{Percentage} = \frac{108^{\circ}}{360^{\circ}} \times 100 = \frac{3}{10} \times 100 = 30\%.

Explanation:

By knowing the central angle, we can determine the portion of the total. We multiply the ratio of the angle to 360∘360^{\circ} by the total money value to find the expense, and by 100100 to find the percentage.

Problem 3:

A library has 12001200 books in total. The categories are: Fiction (600600 books), Science (300300 books), and History (300300 books). Calculate the central angles for each category and draw the pie chart.
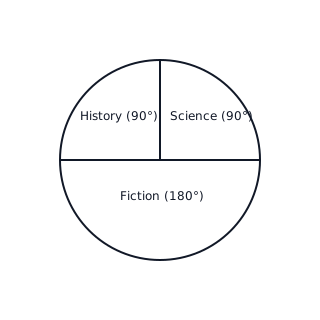
Pie chart with one semi-circle for Fiction and two quarter-circles for Science and History.

Solution:

Total Books=1200\text{Total Books} = 1200 Central Angle for Fiction=(6001200)×360∘=180∘\text{Central Angle for Fiction} = \left( \frac{600}{1200} \right) \times 360^{\circ} = 180^{\circ} Central Angle for Science=(3001200)×360∘=90∘\text{Central Angle for Science} = \left( \frac{300}{1200} \right) \times 360^{\circ} = 90^{\circ} Central Angle for History=(3001200)×360∘=90∘\text{Central Angle for History} = \left( \frac{300}{1200} \right) \times 360^{\circ} = 90^{\circ} Sum check: 180∘+90∘+90∘=360∘180^{\circ} + 90^{\circ} + 90^{\circ} = 360^{\circ}.

Explanation:

We calculate the proportion of each book category relative to the total number of books and multiply by the total degrees in a circle (360∘360^{\circ}). Fiction takes up half the circle, while Science and History take up a quarter each.

Problem 4:

The following pie chart shows the percentage of time a student spends on different activities in a day. If 'Sleep' accounts for 3313%33\frac{1}{3}\%, calculate the central angle for Sleep.
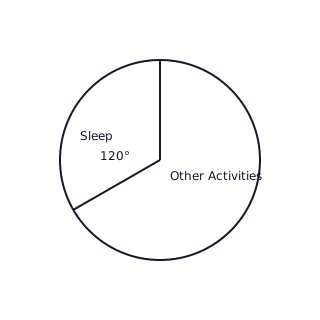
Pie chart with a 120 degree sector labeled Sleep.

Solution:

Percentage for Sleep=3313%=1003%\text{Percentage for Sleep} = 33\frac{1}{3}\% = \frac{100}{3}\% Central Angle=(100/3100)×360∘\text{Central Angle} = \left( \frac{100/3}{100} \right) \times 360^{\circ} Central Angle=13×360∘=120∘\text{Central Angle} = \frac{1}{3} \times 360^{\circ} = 120^{\circ}

Explanation:

To find the central angle from a percentage, we treat the percentage as a fraction of 100100 and apply it to the 360∘360^{\circ} of the circle.