
Review the key concepts, formulae, and examples before starting your quiz.
🔑Concepts
A pictograph is a visual representation of data using images, icons, or symbols. Each symbol represents a specific quantity, which is defined by a 'Key' or 'Scale'. This method makes complex data easy to compare and understand at a glance.
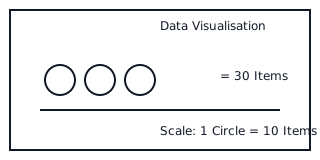
The 'Scale' is the most critical part of a pictograph. It determines how many units of data one symbol stands for. For example, if book icon books, then icons represent books.

Partial symbols are often used to represent values smaller than the scale. Usually, a half-symbol represents exactly half of the scale value. For instance, if a star represents units, a half-star represents units.
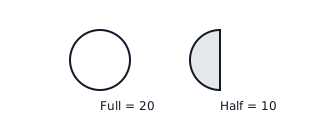
Interpreting a pictograph involves multiplying the number of symbols by the scale value. Conversely, drawing a pictograph requires dividing the given data by the scale to find the number of symbols needed.
📐Formulae
💡Examples
Problem 1:
The following data shows the number of bicycles sold by a shop in three days: Monday = 30, Tuesday = 45, Wednesday = 20. If we use the scale , how many symbols (including half symbols) must be drawn for each day?
Solution:
- For Monday: symbols.
- For Tuesday: symbols. This means we draw full symbols and half symbol.
- For Wednesday: symbols.
Explanation:
To find the number of icons, we divide each day's total by the scale (). Since Tuesday has 45, which is not a multiple of 10, the remainder 5 is represented by exactly half of one symbol.
Problem 2:
A pictograph represents the number of trees in a park. The key states . If the row for 'Mango Trees' contains full icons and half icon, calculate the total number of Mango trees.
Solution:
- Value of full icons = trees.
- Value of half icon = trees.
- Total number of trees = trees.
Explanation:
We first calculate the total value of the complete symbols and then add the value of the partial symbol, which is determined by dividing the scale value by 2.
Problem 3:
A fruit seller sold apples over three hours: Hour 1: kg, Hour 2: kg, Hour 3: kg. Draw a pictograph using the scale .
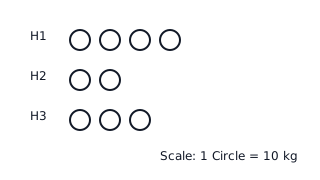
Solution:
- Calculate symbols for Hour 1: symbols.
- Calculate symbols for Hour 2: symbols.
- Calculate symbols for Hour 3: symbols.
Explanation:
We divide the quantity of apples in each hour by the scale () to find the number of apple icons to draw for each row.
Problem 4:
A school library uses a symbol of a square to represent books. If the 'Science' section has full squares and half square, find the total number of science books.
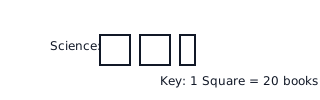
Solution:
Explanation:
Identify the scale (). Multiplied the number of full symbols by . Added half the scale value for the partial symbol to get the final count.