
Review the key concepts, formulae, and examples before starting your quiz.
🔑Concepts
A pie chart is a circular statistical graphic, which is divided into slices or sectors to illustrate numerical proportions.
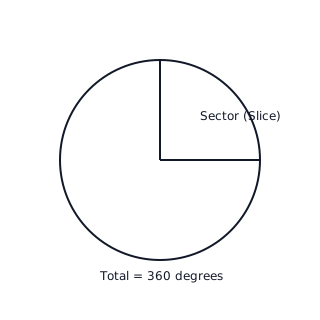
The entire circle represents the total sum of all data values, and it always adds up to .
The size of each sector is proportional to the quantity it represents. Larger quantities result in larger angles and larger slices.
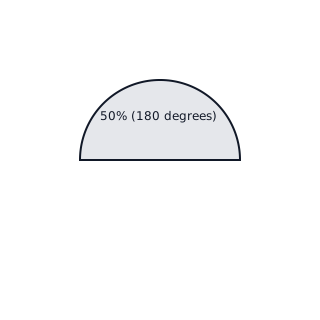
To find the angle for a category, use the proportion of that category relative to the total, then multiply by .
📐Formulae
💡Examples
Problem 1:
In a survey of 40 students about their favorite fruit, 10 students chose 'Apple'. What fraction of the pie chart should the 'Apple' sector occupy, and what is the angle of this sector?
Solution:
Fraction = ; Angle = .
Explanation:
To find the fraction, divide the category value by the total: . To find the angle, multiply the fraction by the total degrees in a circle: .
Problem 2:
A pie chart showing favorite colors has a sector for 'Blue' with an angle of . If 60 people were surveyed in total, how many people chose Blue?
Solution:
30 people.
Explanation:
Since is exactly half of (), the number of people who chose Blue is half of the total survey count. .
Problem 3:
A pie chart is divided into three sections: A, B, and C. Section A is and Section B is . What is the angle for Section C?
Solution:
.
Explanation:
The total sum of angles in a pie chart must be . Therefore, Angle C = .
Problem 4:
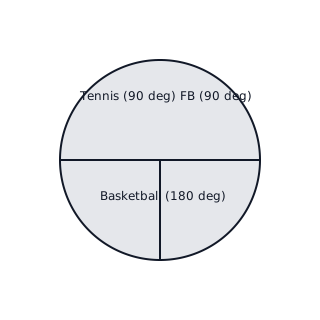
A school club has 20 members: 5 play Football, 10 play Basketball, and 5 play Tennis. Calculate the angles for each sport to draw a pie chart.
Solution:
Explanation:
First, find the total number of members (). For each sport, divide the number of players by the total and multiply by the total degrees in a circle (). Basketball takes up exactly half the circle () because is half of .
Problem 5:
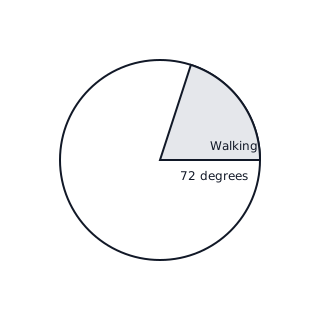
In a pie chart representing transport methods, the 'Walking' sector has an angle of . If the chart represents a total of 50 students, how many students walk to school?
Solution:
Explanation:
To find the frequency from the angle, divide the sector angle by to find the fraction of the total. Then multiply this fraction by the total number of students ().