
Review the key concepts, formulae, and examples before starting your quiz.
🔑Concepts
A Bar Graph is a visual representation of data using rectangular bars of equal width, where the length or height of each bar is proportional to the value it represents.
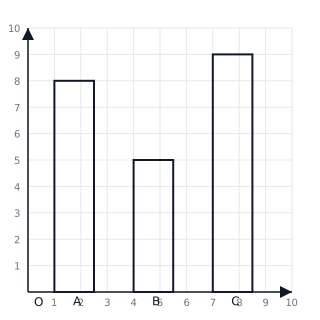
Every bar graph must have a 'Scale'. The scale tells us how many units of data are represented by a unit length of the bar (e.g., ). All bars must have uniform width and equal spacing between them.
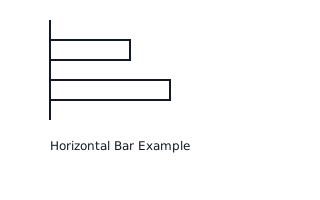
Bar graphs can be drawn vertically or horizontally. In a vertical bar graph, the bars stand on the -axis and their height represents the value. In a horizontal bar graph, the bars start from the -axis and their length represents the value.
Data collection is the first step. Data is usually organized in a frequency table before being plotted on the graph. The bars are then drawn according to the frequencies recorded in the table.
📐Formulae
💡Examples
Problem 1:
In a class of students, the number of students who like different flavors of ice cream is as follows: Vanilla: , Chocolate: , Mango: , and Strawberry: . If you are drawing a bar graph with a scale of , calculate the height of each bar.
Solution:
- Height of Vanilla bar =
- Height of Chocolate bar =
- Height of Mango bar =
- Height of Strawberry bar =
Explanation:
To find the height of each bar, we divide the actual data value by the scale value chosen for the Y-axis.
Problem 2:
A bar graph shows the number of books sold by a shopkeeper in four days. The scale is . If the bar for 'Wednesday' is long, how many books were sold on that day?
Solution:
- Given Scale:
- Height of the bar for Wednesday =
- Total books sold =
Explanation:
To find the actual quantity from a graph, multiply the measured length of the bar by the value of the scale.
Problem 3:
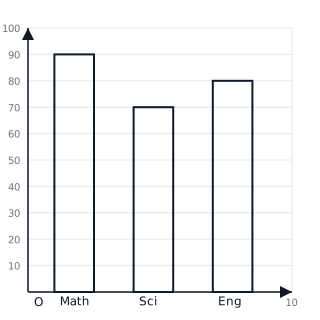
The following data shows the marks obtained by a student in three subjects: Math (), Science (), and English (). Draw a vertical bar graph using the scale .
Solution:
- Identify the values: Math , Science , English .
- Determine the height of bars based on the scale (): Math: Science: English:
- Draw the bars on the graph with heights , , and respectively.
Explanation:
Since each unit on the -axis represents marks, we divide the total marks by to find the number of units to plot for each subject.
Problem 4:
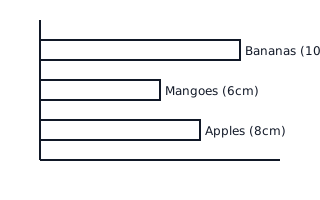
A fruit seller sold kg of Apples, kg of Mangoes, and kg of Bananas. If the bar for Bananas is long in a horizontal bar graph, find the scale used and the length of the bar for Mangoes.
Solution:
- For Bananas: Value , Bar length .
- Scale .
- Length for Mangoes: Value .
- Length .
Explanation:
By comparing the actual quantity of Bananas to the bar length, we find the scale (). We then use this scale to determine that the of Mangoes requires a bar.