
Review the key concepts, formulae, and examples before starting your quiz.
🔑Concepts
A Pie Chart, also known as a Chapati Chart, is a circular graph used to compare parts of a whole. Each 'slice' of the pie represents a category, and the size of the slice shows its proportion relative to the total.
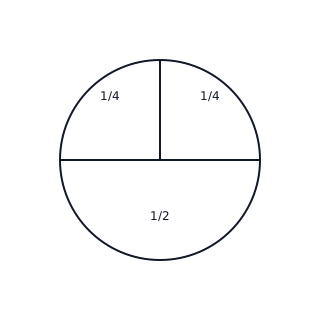
The entire circle represents the 'Whole' or the total value. For example, if we are charting a class of students, the full circle equals students.
The size of each slice is proportional to the fraction it represents. A slice that takes up half the circle represents of the total, while a quarter-slice represents .
To find the actual number represented by a slice, multiply the fraction of the slice by the total number. For example, of is .
📐Formulae
💡Examples
Problem 1:
A class of students was asked about their favorite fruit. The Pie Chart shows that of the students like Mangoes, like Apples, and like Bananas. Calculate the number of students for each fruit.
Solution:
- Total students = .
- Students who like Mangoes = students.
- Students who like Apples = students.
- Students who like Bananas = students. \nCheck: .
Explanation:
To find the number of students, multiply the total count by the fraction represented by each slice of the pie chart.
Problem 2:
In a library of books, a Pie Chart shows that Science books occupy of the chart. How many Science books are there in the library?
Solution:
- Total number of books = .
- Fraction of Science books = .
- Number of Science books = .
- Calculation: . \nSo, there are Science books.
Explanation:
Divide the total value by the denominator of the fraction to find the value represented by that specific part of the pie chart.
Problem 3:
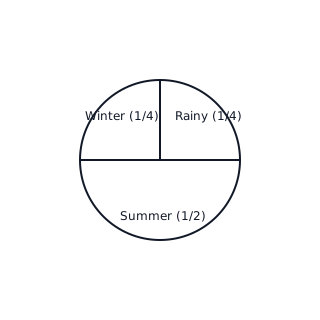
A survey was conducted among children about their favorite season. The pie chart shows that of the children like Summer, like Winter, and the remaining like Rainy season. Find the number of children who like the Rainy season.
Solution:
Explanation:
Since the Rainy season slice is exactly one-quarter of the total circle, we divide the total number of children () by to find the value for that specific slice.
Problem 4:
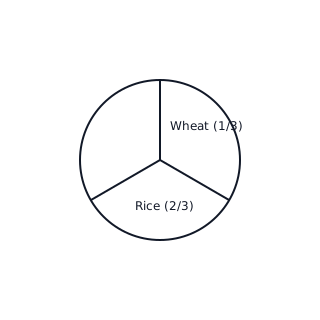
A farmer uses his acres of land to grow different crops. Based on the chart, of the land is used for Wheat, and the rest is used for Rice. How many acres are used for Rice?
Solution:
Explanation:
If of the circle is Wheat, then the remaining must be Rice because the sum of all parts equals . We then calculate of the total acres.