
Review the key concepts, formulae, and examples before starting your quiz.
🔑Concepts
A Bar Graph uses rectangular bars of equal width to represent data visually. The height (or length) of each bar is proportional to the value it represents.
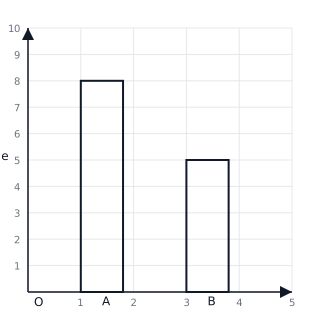
The vertical line is called the Y-axis (representing values/numbers), and the horizontal line is called the X-axis (representing categories).
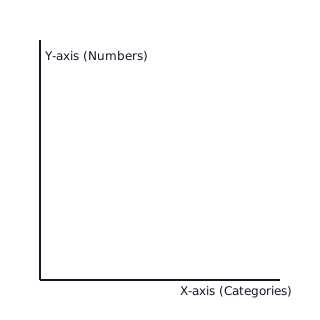
The 'Scale' tells us what each unit on the Y-axis represents. For example, if the scale is , a bar that is high represents .
Comparison is easy with bar graphs: the tallest bar represents the maximum value, and the shortest bar represents the minimum value.
📐Formulae
💡Examples
Problem 1:
A bar graph shows the number of students who like different sports. The scale is . If the bar for 'Cricket' is tall and the bar for 'Football' is tall, find the total number of students who like these two sports.
Solution:
Step 1: Calculate the number of students who like Cricket. Step 2: Calculate the number of students who like Football. Step 3: Find the total sum.
Explanation:
We use the scale factor to convert the visual height of the bars (in cm) into the actual number of students before adding them together.
Problem 2:
In a class, the number of students who own pets are: Dog (), Cat (), and Fish (). If you draw a bar graph with a scale of , how many units high will the bar for 'Cat' be, and how many more students have Dogs than Fish?
Solution:
Step 1: Find the height of the 'Cat' bar. Step 2: Calculate the difference between Dog owners and Fish owners.
Explanation:
To find the height of a bar for a graph, divide the actual value by the scale. To find 'how many more', subtract the smaller value from the larger value.
Problem 3:
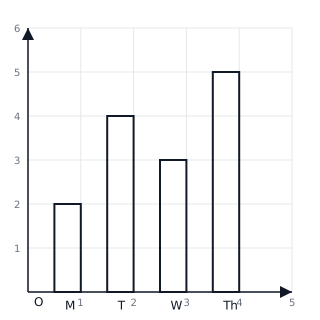
A bar graph shows the number of ice creams sold in four days. The scale on the Y-axis is . If the bars for Monday to Thursday are , , , and units high respectively, find the total number of ice creams sold.
Solution:
Explanation:
First, calculate the value of each bar by multiplying the height by the scale (): Monday: Tuesday: Wednesday: Thursday: Total = ice creams.
Problem 4:
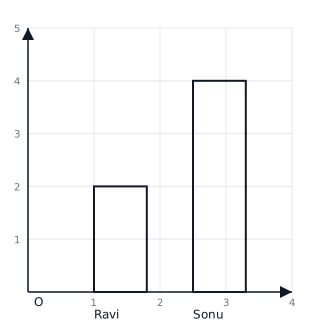
The following graph shows the number of trees planted by two friends, Ravi and Sonu. If the scale is , how many more trees did Sonu plant than Ravi?
Solution:
Explanation:
Identify the unit heights from the graph: Ravi = , Sonu = . Calculate the actual number of trees: Ravi: trees. Sonu: trees. Difference: trees.