
Review the key concepts, formulae, and examples before starting your quiz.
🔑Concepts
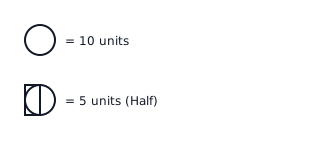
A pictograph uses icons or pictures to represent a specific quantity of data. Each icon is linked to a 'Key' which defines its value.
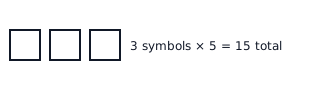
To find the total value represented by a row, multiply the number of symbols by the value of one symbol:
When the data is not a multiple of the key, we use partial symbols. For example, if symbol items, then items are shown by a half-symbol.

The key must be chosen carefully to ensure the number of symbols to draw is manageable and fits the space provided.
📐Formulae
💡Examples
Problem 1:
The following pictograph shows the number of apples sold by a shopkeeper in three days. The key says: . If Monday shows icons and Tuesday shows and a half icons, find the total kilograms of apples sold on both days.
Solution:
Step 1: Calculate apples sold on Monday. Number of icons = . Value per icon = . So, . Step 2: Calculate apples sold on Tuesday. Number of icons = (3 full and 1 half). Value of half-icon = . So, . Step 3: Find the total. .
Explanation:
We use the key to convert the visual icons into numerical values by multiplying the number of icons by the weight each icon represents, ensuring we treat the half-icon as half the weight.
Problem 2:
A class has students who like Chocolate ice cream and students who like Vanilla. If we draw a pictograph where , how many stars must be drawn for each flavor?
Solution:
Step 1: Calculate stars for Chocolate. . Key = . Number of stars = stars. Step 2: Calculate stars for Vanilla. . Key = . Number of stars = stars.
Explanation:
To determine how many symbols to draw, we divide the total quantity of data for each category by the value assigned to one symbol in the key.
Problem 3:
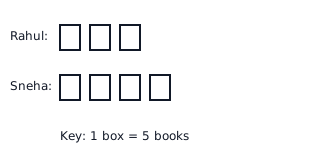
The following pictograph shows the number of books read by four friends in a month. If each book icon represents books, find the total number of books read by Rahul and Sneha combined.
Solution:
Explanation:
Rahul has book icons next to his name. Since each icon equals books, he read books. Sneha has icons, so she read books. Adding them together gives .
Problem 4:
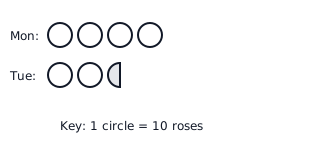
A flower shop sold roses on Monday and roses on Tuesday. Represent this data in a pictograph using the key: . How many full and half icons are needed for Tuesday?
Solution:
Explanation:
Since icon equals roses, we divide the total roses by . For Tuesday, gives with a remainder of . Since is half of , we draw two full flowers and one half flower.