
Review the key concepts, formulae, and examples before starting your quiz.
🔑Concepts
A line plot is a graph that shows the frequency of data along a number line. Each piece of data is represented by a symbol, usually an 'X', placed above the value on the line.
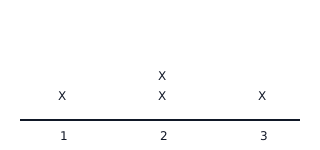
The horizontal scale on a line plot represents the categories or measurements being tracked (e.g., length, weight, or counts). It is important that the intervals between numbers are equal.
The 'Mode' in a line plot is the value that has the highest column of 'X' marks, indicating it is the most frequent value in the data set.
Line plots help in identifying the 'Outliers', which are data points that are located far away from the rest of the data clusters.
To find the total number of items surveyed, simply count every 'X' mark displayed on the entire plot.
📐Formulae
💡Examples
Problem 1:
Students measured the lengths of their erasers to the nearest centimeter: . Create a line plot and find the range and mode.
Solution:
Step 1: Sort the data: . Step 2: Draw a number line from to . Step 3: Place three 'X' marks above , two 'X's above , one 'X' above , and one 'X' above . Step 4: Range = . Step 5: Mode = .
Explanation:
The range is found by subtracting the minimum value () from the maximum value (). The mode is because it has the tallest stack of 'X' marks.
Problem 2:
A group of friends tracked how much juice they drank in liters: . Find the most common amount of juice drank.
Solution:
Step 1: Identify the frequencies: appears once, appears three times, and appears once. Step 2: On a line plot, the tallest stack would be above .
Explanation:
The most common amount is the mode. Since has the highest frequency (three times), it is the most common amount.
Problem 3:
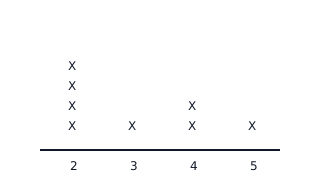
Ms. Sarah recorded the number of books read by her students over the summer: . Represent this data on a line plot and identify the number of books most students read.
Solution:
- Organize the data: (4 times), (1 time), (2 times), (1 time).
- Draw a number line from to .
- Place 'X' marks for each occurrence.
- The most frequent value (mode) is books.
Explanation:
By counting the 'X' marks, we see that the number has the tallest stack (4 marks), making it the most common amount.
Problem 4:
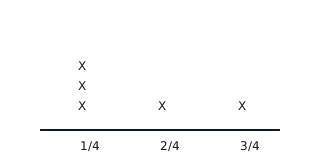
A baker measured the weights of several bags of flour to the nearest quarter kg: kg, kg, kg, kg, kg. Based on the line plot, what is the total number of bags and the range of weights?
Solution:
- Plot the data: (3 marks), (1 mark), (1 mark).
- Total count of bags = .
- Range = or kg.
Explanation:
The total number of bags is the sum of all 'X' marks. The range is the difference between the heaviest bag and the lightest bag.