
Review the key concepts, formulae, and examples before starting your quiz.
🔑Concepts
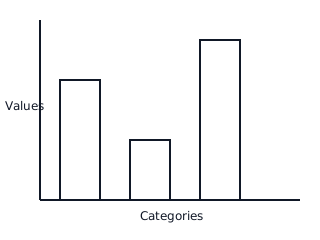
A bar graph uses rectangular bars of equal width to represent data. The height (vertical) or length (horizontal) of each bar corresponds to its value on a numbered scale.
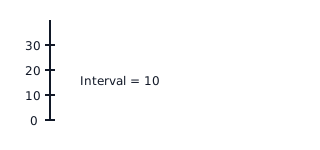
The Scale and Interval determine how we read the graph. The interval is the constant difference between numbers on the axis. For example, if the markings are , the interval is .
To interpret a bar graph, look at the top of a bar and follow it horizontally to the -axis to read the exact value. This allows for comparisons such as 'highest', 'lowest', or calculating the range.
Graphs must include a Title to explain the data and Labels for both axes ( and ) to identify what is being measured.
📐Formulae
💡Examples
Problem 1:
A bar graph shows the favorite colors of a Grade 4 class. The 'Blue' bar reaches the number on the -axis, and the 'Red' bar reaches the number . How many more students prefer Blue than Red?
Solution:
Explanation:
To find how many 'more' students prefer one category, identify the values of the two bars and subtract the smaller value from the larger value.
Problem 2:
In a survey about pets, the bar graph has the following values: Dogs = , Cats = , and Fish = . What is the total number of students who participated in the survey?
Solution:
Explanation:
To find the total number of participants, add together the frequencies represented by every bar in the graph.
Problem 3:
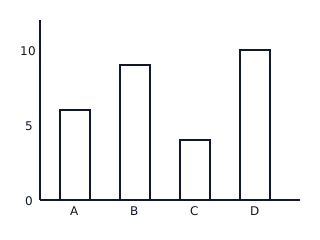
The following bar graph shows the number of books read by four friends over the summer: Ana ( books), Ben ( books), Chloe ( books), and Dan ( books). How many more books did Dan read than Chloe?
Solution:
books.
Explanation:
First, identify the value for Dan from the graph, which is . Next, identify the value for Chloe, which is . To find the difference, subtract Chloe's count from Dan's count: .
Problem 4:
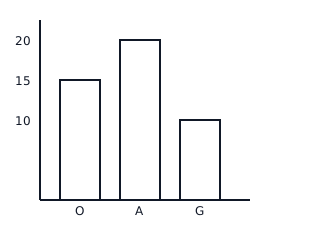
A juice shop tracks sales of three flavors: Orange, Apple, and Grape. Looking at the graph, what is the total number of juices sold if Orange = , Apple = , and Grape = ?
Solution:
juices.
Explanation:
To find the total frequency, add the values of all bars together. Summing the individual sales gives (Orange) + (Apple) + (Grape) = .