
Review the key concepts, formulae, and examples before starting your quiz.
🔑Concepts
Data can be represented visually using Pictographs, where a symbol represents a specific quantity defined by a 'Key'. Interpreting a pictograph requires multiplying the number of symbols by the key value.
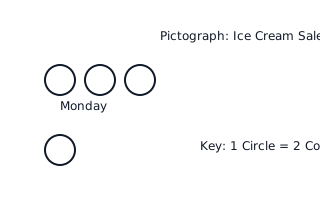
Bar Graphs use rectangular bars of different heights or lengths to show and compare data. The height of the bar corresponds to a value on the scale (usually the vertical axis).
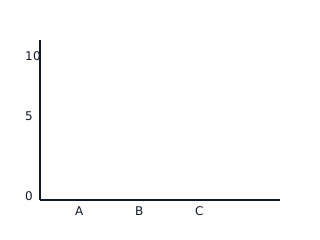
Interpreting data involves answering questions like 'Which category has the most?', 'Which has the least?', and 'What is the difference between two categories?'
Tally Marks are a quick way to record data in groups of . Every fifth mark is a diagonal line across the previous four vertical marks: with a slash.
📐Formulae
💡Examples
Problem 1:
In a pictograph about favorite fruits, the Key states that . If the row for 'Grapes' has apple icons, how many students chose grapes as their favorite fruit?
Solution:
Step 1: Identify the number of symbols for Grapes, which is . Step 2: Identify the value of each symbol from the key, which is . Step 3: Multiply the number of symbols by the key value: .
Explanation:
To find the actual value in a pictograph, you must multiply the number of pictures seen by the value each picture represents in the key.
Problem 2:
A bar graph shows that children like Dogs and children like Cats. How many more children prefer Dogs than Cats?
Solution:
Step 1: Note the value for Dogs, which is . Step 2: Note the value for Cats, which is . Step 3: Subtract the smaller number from the larger number: .
Explanation:
When a question asks 'how many more' or 'the difference,' we use subtraction to compare the two heights on the bar graph.
Problem 3:
Look at the pictograph of 'Books Read'. If the key is , how many books did Sarah read if she has symbols next to her name?

Solution:
Sarah read books.
Explanation:
According to the key, each symbol represents books. Sarah has symbols. Total books = .
Problem 4:
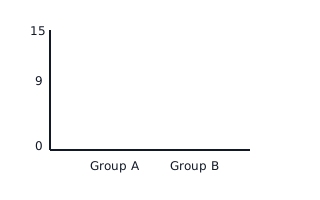
A bar graph shows the number of stars collected by students. Group A has a bar reaching and Group B has a bar reaching . How many more stars does Group A have than Group B?
Solution:
stars.
Explanation:
To find how many more, we subtract the value of Group B from Group A: .