
Review the key concepts, formulae, and examples before starting your quiz.
🔑Concepts
In direct proportion, the relationship between two variables and is defined by . Graphically, this is represented by a straight line passing through the origin . The constant of proportionality represents the gradient of the line.
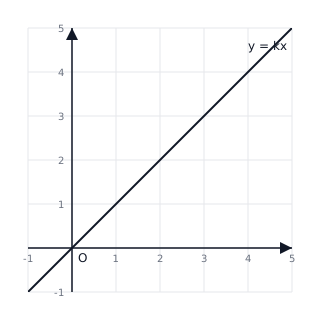
In inverse proportion, the relationship is defined by or . As one variable increases, the other decreases. The graph is a hyperbola that never touches the axes (asymptotic to and ).
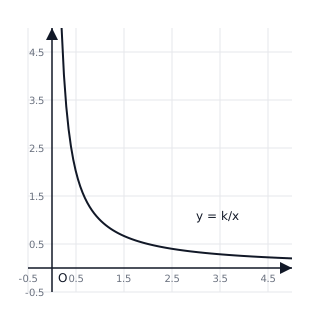
Direct proportion to a square, , results in a parabolic curve starting at the origin. The rate of change in increases as increases.
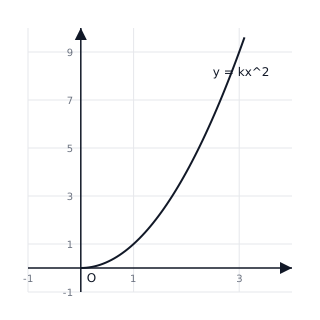
Identifying from a graph: For a direct proportion graph, pick any point on the line (except the origin) and calculate . For an inverse proportion graph, pick any point and calculate .
📐Formulae
💡Examples
Problem 1:
The variable is directly proportional to the square of . When , . Find the value of when .
Solution:
- Set up the equation:
- Substitute and :
- Write the specific equation:
- Substitute :
Explanation:
Since is proportional to , we find the constant first using the given values, then use that constant to calculate the new value of .
Problem 2:
The pressure of a gas is inversely proportional to its volume . When , . Find the pressure when the volume is .
Solution:
- Set up the equation:
- Substitute and :
- Write the specific equation:
- Substitute :
Explanation:
In inverse proportion, the product of the variables is constant (). Increasing the volume results in a proportional decrease in pressure.
Problem 3:
A graph of against is a straight line through the origin. If the line passes through the point , determine the constant of proportionality and the equation of the line.
Solution:
- Since the graph is a straight line through the origin, .
- Substitute the coordinates :
- The equation is .
Explanation:
The gradient of a direct proportion graph is the constant of proportionality . Use the point to find the slope.
Problem 4:
The graph shows the relationship between variables and where is directly proportional to . Given that the graph passes through , find the value of and calculate when .
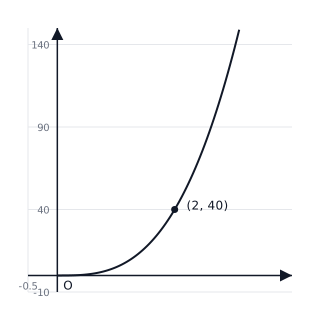
Solution:
- Set up the equation: .
- Substitute the point : .
- Solve for : .
- Find when : .
Explanation:
Since is proportional to , we use the cubic model. Substituting the known coordinates allows us to find the constant , which remains the same for all points on this curve.
Problem 5:
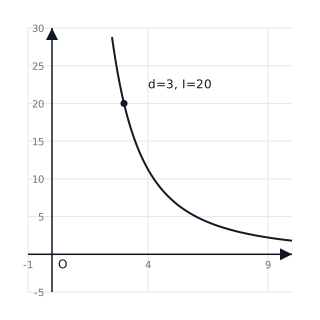
The intensity of light is inversely proportional to the square of the distance from the source. At a distance of meters, the intensity is units. Find the intensity at a distance of meters.
Solution:
- State the relationship: .
- Find : .
- Formulate the equation: .
- Calculate for : units.
Explanation:
This follows the inverse square law. We first determine the constant of proportionality by substituting the initial conditions, then use the constant to evaluate the second state.