
Review the key concepts, formulae, and examples before starting your quiz.
🔑Concepts
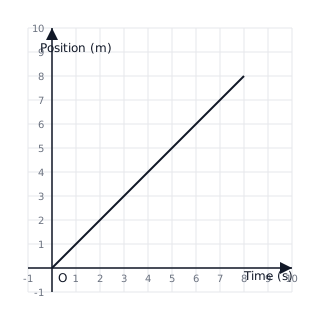
A position-time graph (or distance-time graph) for an object in uniform motion is always a straight line passing through the origin if the object starts from rest. The slope of this line represents the speed (or velocity) of the object, given by .
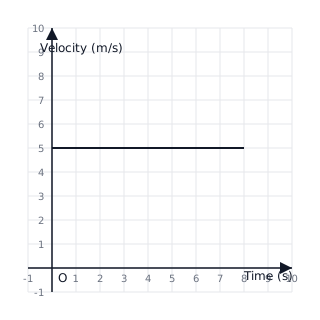
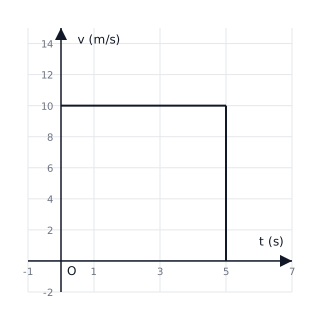
In uniform motion, the velocity remains constant over time. Therefore, the velocity-time graph is a horizontal straight line parallel to the time axis (x-axis). The slope of this graph is zero, indicating that the acceleration is zero ().
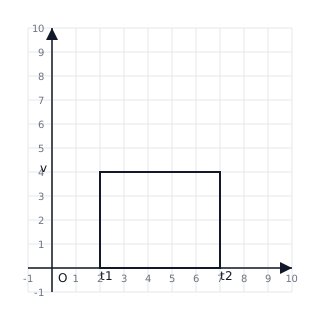
The area under a velocity-time graph represents the displacement of the object. For uniform motion, this area forms a rectangle. The area is calculated as , which equals the magnitude of displacement .
The steepness of the slope in a position-time graph indicates the magnitude of the velocity. A steeper line represents a higher constant velocity, while a less steep line represents a lower constant velocity.
📐Formulae
💡Examples
Problem 1:
An object travels in and then another in . What is the average speed of the object?
Solution:
Total distance traveled by the object . Total time taken . Average speed .
Explanation:
Since the object covers the same distance in different time intervals, this is an example of non-uniform motion. Average speed is used to describe the overall rate of motion.
Problem 2:
A bus decreases its speed from to in . Find the acceleration of the bus.
Solution:
Initial velocity . Final velocity . Time . Acceleration .
Explanation:
The negative sign indicates retardation or deceleration, meaning the object is slowing down. This change in velocity indicates non-uniform motion.
Problem 3:
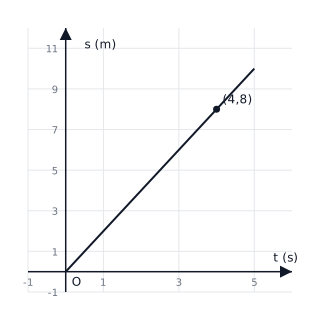
Based on the provided position-time graph, calculate the velocity of the object between and .
Solution:
From the graph, at , the position . At , the position . Using the formula for velocity: The velocity of the object is .
Explanation:
Velocity is determined by the slope of the position-time graph. By picking two points on the line and dividing the change in position by the change in time, we find the constant speed.
Problem 4:
A car moves with a constant velocity of for . Draw the velocity-time graph and calculate the displacement during this interval.
Solution:
The velocity-time graph is a horizontal line at . Displacement is the area under the graph: The displacement of the car is .
Explanation:
In a velocity-time graph for uniform motion, the displacement is the product of the constant velocity and the time duration, which corresponds geometrically to the area of the rectangle formed under the graph.