krit.club logo

Physics: Motion and Mechanics - Speed, Velocity, Acceleration, and Motion Graphs

Grade 8IB

Review the key concepts, formulae, and examples before starting your quiz.

🔑Concepts

•

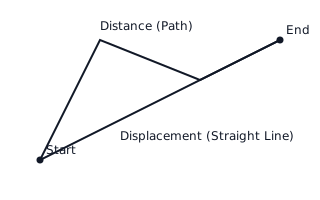
Speed vs. Velocity: Speed is a scalar quantity representing the rate at which an object covers distance (s=dts = \frac{d}{t}). Velocity is a vector quantity that includes direction, defined as the rate of change of displacement (v⃗=ΔsΔt\vec{v} = \frac{\Delta s}{\Delta t}).

A diagram showing the difference between distance (curved path) and displacement (straight line vector).
•

Acceleration: Acceleration measures how quickly velocity changes over time (a=v−uta = \frac{v - u}{t}). On a Velocity-Time graph, a constant positive slope indicates uniform acceleration, while a horizontal line indicates constant velocity (zero acceleration).
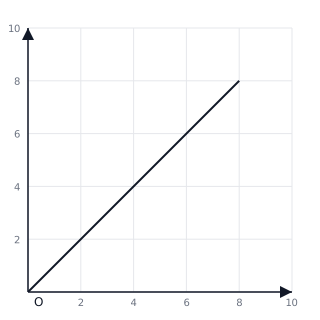
A velocity-time graph showing a straight line with a positive gradient, representing constant acceleration.
•

Distance-Time Graphs: The slope (gradient) of a Distance-Time graph represents the speed of the object. A steeper slope indicates a higher speed, whereas a flat horizontal line indicates the object is stationary.
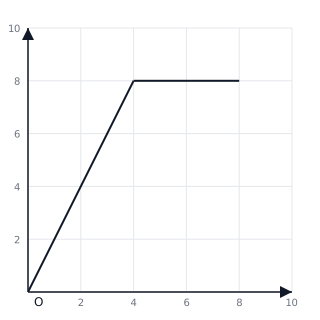
A distance-time graph showing a moving phase and a stationary phase.
•

Area under Velocity-Time Graph: The total displacement of an object can be determined by calculating the geometric area under the line on a Velocity-Time (v−tv-t) graph. For a constant acceleration, this often forms a triangle or a trapezium.

📐Formulae

Average Speed=Total DistanceTotal Time\text{Average Speed} = \frac{\text{Total Distance}}{\text{Total Time}}

v⃗=sfinal−sinitialt\vec{v} = \frac{s_{final} - s_{initial}}{t}

a=v−uta = \frac{v - u}{t}

Displacement (Area under v-t graph)=base×height (for rectangles)\text{Displacement (Area under v-t graph)} = \text{base} \times \text{height} \text{ (for rectangles)}

Displacement (Area under v-t graph)=12×base×height (for triangles)\text{Displacement (Area under v-t graph)} = \frac{1}{2} \times \text{base} \times \text{height} \text{ (for triangles)}

💡Examples

Problem 1:

A cyclist travels 150 m150\text{ m} North and then turns around to travel 250 m250\text{ m} South. Calculate the total distance and the final displacement.

Solution:

Total Distance: 150 m+250 m=400 m150\text{ m} + 250\text{ m} = 400\text{ m}. Displacement: 150 m+(−250 m)=−100 m150\text{ m} + (-250\text{ m}) = -100\text{ m} (or 100 m100\text{ m} South).

Explanation:

Distance is the sum of all paths taken: 150+250400\begin{array}{r} 150 \\ + 250 \\ \hline 400 \end{array} Displacement considers direction; taking North as positive and South as negative: 150−250−100\begin{array}{r} 150 \\ - 250 \\ \hline -100 \end{array}

Problem 2:

A car accelerates from rest (u=0 m/su = 0\text{ m/s}) to a velocity of 30 m/s30\text{ m/s} in 6 seconds6\text{ seconds}. Calculate the acceleration.

Solution:

a=30 m/s−0 m/s6 s=5 m/s2a = \frac{30\text{ m/s} - 0\text{ m/s}}{6\text{ s}} = 5\text{ m/s}^2

Explanation:

Acceleration is found by dividing the change in velocity (Δv=v−u\Delta v = v - u) by the time taken (tt).

Problem 3:

In a Velocity-Time graph, a train moves at a constant speed of 20 m/s20\text{ m/s} for 10 seconds10\text{ seconds}. What is the displacement?

Solution:

Area=velocity×time=20 m/s×10 s=200 m\text{Area} = \text{velocity} \times \text{time} = 20\text{ m/s} \times 10\text{ s} = 200\text{ m}

Explanation:

For a constant velocity, the area under the Velocity-Time graph is a rectangle. The area represents the displacement.

Problem 4:

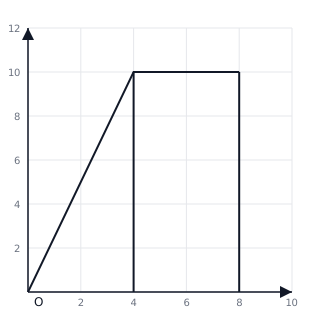
A toy car moves along a straight track. Its motion is described by the Velocity-Time graph below. Calculate the total displacement of the car during the first 8 seconds8\text{ seconds}.

A Velocity-Time graph showing acceleration to 10 m/s over 4 seconds, followed by 4 seconds of constant velocity.

Solution:

Displacement=Area of Triangle+Area of Rectangle\text{Displacement} = \text{Area of Triangle} + \text{Area of Rectangle} Area1=12×base×height=12×4 s×10 m/s=20 m\text{Area}_1 = \frac{1}{2} \times \text{base} \times \text{height} = \frac{1}{2} \times 4\text{ s} \times 10\text{ m/s} = 20\text{ m} Area2=base×height=(8 s−4 s)×10 m/s=40 m\text{Area}_2 = \text{base} \times \text{height} = (8\text{ s} - 4\text{ s}) \times 10\text{ m/s} = 40\text{ m} Total Displacement=20 m+40 m=60 m\text{Total Displacement} = 20\text{ m} + 40\text{ m} = 60\text{ m}

Explanation:

To find displacement from a velocity-time graph, we calculate the area under the curve. The motion consists of a constant acceleration from 00 to 4 s4\text{ s} (triangle) and a constant velocity from 44 to 8 s8\text{ s} (rectangle).

Problem 5:

An athlete runs 40 m40\text{ m} East and then 30 m30\text{ m} North in a total time of 10 seconds10\text{ seconds}. Determine the magnitude of the average velocity.
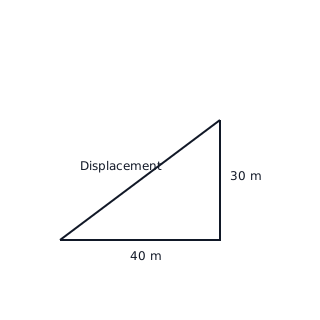
A right-angled triangle representing the path of an athlete moving East and then North.

Solution:

Displacement(Δs)=402+302=1600+900=2500=50 m\text{Displacement} (\Delta s) = \sqrt{40^2 + 30^2} = \sqrt{1600 + 900} = \sqrt{2500} = 50\text{ m} Average Velocity=DisplacementTime=50 m10 s=5 m/s\text{Average Velocity} = \frac{\text{Displacement}}{\text{Time}} = \frac{50\text{ m}}{10\text{ s}} = 5\text{ m/s}

Explanation:

Velocity is displacement over time. Displacement is the straight-line distance from start to end, found here using the Pythagorean theorem since the paths are perpendicular.