
Statistics and Probability - Measures of dispersion: range, interquartile range, and box-and-whisker plots
Review the key concepts, formulae, and examples before starting your quiz.
🔑Concepts
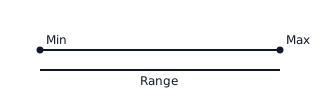
The Range is the simplest measure of dispersion, representing the total spread of the data. It is calculated as the difference between the maximum value and the minimum value: .
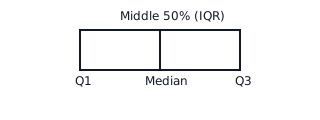
The Interquartile Range (IQR) measures the spread of the middle 50% of the data. It is the difference between the upper quartile () and the lower quartile (): . It is less affected by outliers than the range.
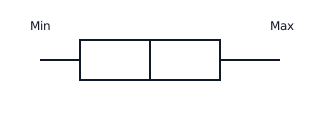
A Box-and-Whisker Plot visually summarizes a data set using a five-number summary: Minimum, , Median, , and Maximum.
Outliers are extreme values that fall significantly outside the rest of the data. Mathematically, they are values smaller than or larger than .
📐Formulae
💡Examples
Problem 1:
The marks obtained by 9 students in a quiz are: . Calculate the Range and the Interquartile Range (IQR).
Solution:
- Order the data from least to greatest:
- Find the Range:
- Find the Median (): The middle value of 9 numbers is the position:
- Find : The median of the lower half () is
- Find : The median of the upper half () is
- Calculate :
Explanation:
To find measures of dispersion, the data must first be ordered. The range gives the total spread (), while the IQR () focuses on the spread of the middle half of the marks, which is less affected by the highest and lowest scores.
Problem 2:
A dataset has , , and . Determine if a value of would be considered an outlier in this dataset.
Solution:
- Calculate the IQR:
- Calculate the multiplier for outliers:
- Calculate the Upper Bound:
- Compare the value to the bound:
Explanation:
Since the value is greater than the upper boundary of , it is statistically classified as an outlier. In a box-and-whisker plot, the whisker would stop at the last data point within the limit, and would be plotted as a separate dot.
Problem 3:
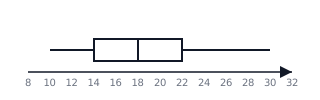
Given the following box-and-whisker plot for the heights (in cm) of a group of plants, identify the five-number summary and calculate the Range and IQR.
Solution:
- Minimum =
- Median =
- Maximum =
cm cm
Explanation:
The whiskers end at the Minimum () and Maximum (). The box starts at () and ends at (). The line inside the box is the Median ().
Problem 4:
A set of data points is: . Use the rule to determine if the value is an outlier.
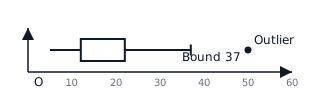
Solution:
- Find Median: Middle value is .
- Find (median of lower half: ): .
- Find (median of upper half: ): .
- Calculate : .
- Calculate Upper Bound: .
- Compare: , therefore is an outlier.
Explanation:
Since exceeds the upper threshold calculated by adding times the interquartile range to the third quartile, it is statistically classified as an outlier.