
Review the key concepts, formulae, and examples before starting your quiz.
🔑Concepts
A circle graph, also known as a pie chart, represents data as sectors of a circle where the size of each sector is proportional to the information it represents.
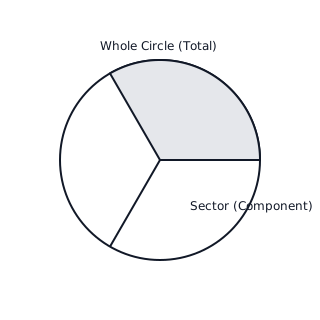
The central angle of each sector is calculated based on the fraction of the total it represents. Since the total angle at the center of a circle is , the formula used is: .
Pie charts are particularly useful for comparing parts of a whole rather than showing changes over time.
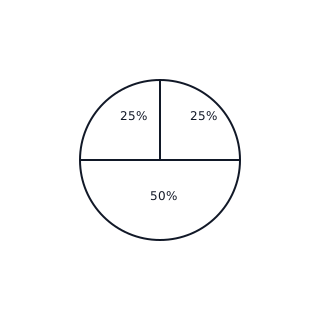
To draw a pie chart, first convert the data values into fractions of the total, then multiply by to find the central angle for each component, and finally use a protractor to draw the sectors.
📐Formulae
💡Examples
Problem 1:
In a school of 720 students, 180 students like Mathematics, 240 like Science, and 300 like English. Calculate the central angle for each subject to represent this data in a pie chart.
Solution:
Step 1: Identify the total value. Total students = .\nStep 2: Calculate the central angle for Mathematics: .\nStep 3: Calculate the central angle for Science: .\nStep 4: Calculate the central angle for English: .\nVerification: .
Explanation:
We find the central angle by taking the value of each subject as a fraction of the total student count and multiplying by .
Problem 2:
A pie chart showing the expenditure of a family has a central angle of for 'Food'. If the total monthly income is 50,000, calculate the amount spent on food.
Solution:
Step 1: Use the relationship between the central angle and the total value.\nStep 2: Amount spent on Food = .\nStep 3: Substitute the values: .\nStep 4: Simplify the fraction: .\nStep 5: Calculate the final amount: .
Explanation:
To find the actual value from a pie chart, we divide the specific sector's angle by the total angle of the circle () and multiply by the total quantity.
Problem 3:
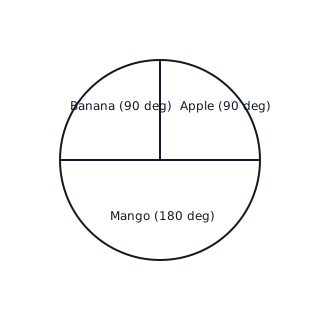
A group of 36 children were asked about their favorite fruit. 18 chose Mango, 9 chose Apple, and 9 chose Banana. Represent this data as a pie chart by calculating the central angles.
Solution:
- Total children = .
- Central angle for Mango: .
- Central angle for Apple: .
- Central angle for Banana: .
Explanation:
Mango occupies half the circle (), while Apple and Banana each occupy a quarter ().
Problem 4:
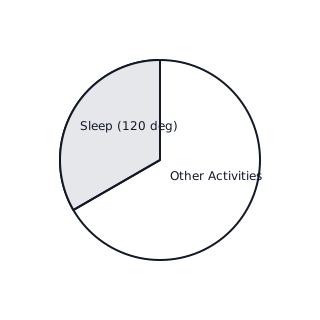
The following pie chart shows the time spent by a student in a day (24 hours). If the sector for 'Sleeping' has a central angle of , how many hours does the student sleep?
Solution:
- Total hours in a day = hours.
- Total angle of a circle = .
- Hours spent sleeping = .
- Hours spent sleeping = hours.
Explanation:
Since the central angle for sleep is , it represents one-third of the total daily cycle of 24 hours.