
Statistics and Probability - Processing and presenting data (Pie charts, Bar charts)
Review the key concepts, formulae, and examples before starting your quiz.
🔑Concepts
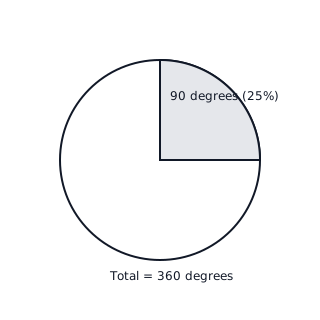
A Pie Chart is a circular graph divided into sectors. Each sector represents a category, and the area (or angle) of each sector is proportional to the frequency of that category relative to the total.
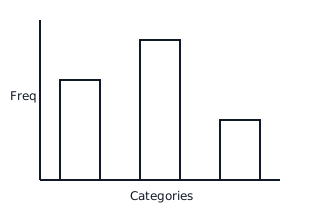
Bar Charts use rectangular bars to show frequencies of different categories. The height of the bar represents the frequency, and all bars must have equal width with equal gaps between them.
To calculate the sector angle for a category in a pie chart, you divide the category's frequency by the total frequency and multiply by .
Comparative bar charts place two or more bars side-by-side for each category to allow for easy comparison between different groups (e.g., Boys vs Girls).
📐Formulae
💡Examples
Problem 1:
A survey of 40 students asked for their favorite fruit. 10 students chose Apple, 15 chose Banana, 5 chose Orange, and 10 chose Grapes. Calculate the angle for the 'Banana' sector in a pie chart.
Solution:
135^\circ
Explanation:
To find the angle, use the formula: (Frequency / Total) * 360. Here, (15 / 40) * 360 = 0.375 * 360 = 135 degrees.
Problem 2:
In a pie chart representing 120 people, the angle for the 'Travel by Bus' sector is 72 degrees. How many people travel by bus?
Solution:
24 people
Explanation:
To find the frequency from the angle, use the formula: (Angle / 360) * Total. Here, (72 / 360) * 120 = 1/5 * 120 = 24.
Problem 3:
A bar chart shows that 8 students have 0 pets, 12 students have 1 pet, and 6 students have 2 pets. What is the total number of students surveyed?
Solution:
26
Explanation:
The total frequency is the sum of the heights of all the bars. Total = 8 + 12 + 6 = 26 students.
Problem 4:
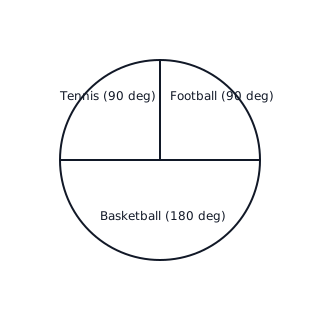
A group of 60 students were asked about their favorite sport. 15 students chose Football, 30 chose Basketball, and 15 chose Tennis. Draw a pie chart to represent this data and calculate the angle for 'Basketball'.
Solution:
Explanation:
Since Basketball represents half of the total students (30 out of 60), its angle is exactly half of the circle (). Football and Tennis share the remaining half equally ( each).
Problem 5:
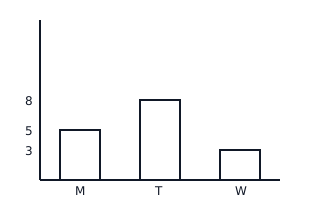
The following bar chart shows the number of cars sold over three days: Monday (5), Tuesday (8), and Wednesday (3). Calculate the total number of cars sold.
Solution:
Explanation:
To find the total, we read the height of each bar on the vertical axis and sum the values: 5 for Monday, 8 for Tuesday, and 3 for Wednesday.