
Review the key concepts, formulae, and examples before starting your quiz.
🔑Concepts
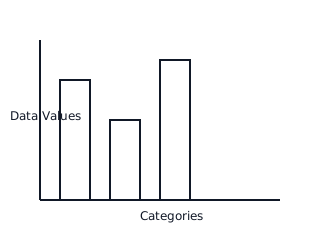
A Bar Graph is a visual representation of data using rectangular bars of uniform width, where the lengths (heights) are proportional to the values they represent.
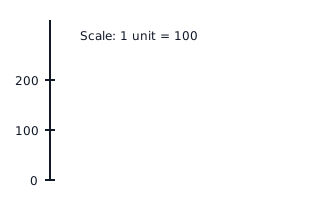
Choosing an appropriate scale is crucial. If the data values range from to , a scale of is better than . The scale determines how many actual units one division on the -axis represents.
In a Bar Graph, the width of the bars and the spacing between them must be uniform to ensure clarity and accurate comparison of the data points.
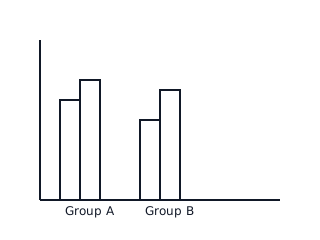
Double Bar Graphs are used to compare two sets of data simultaneously. For example, comparing the sales of two different products over several months using pairs of adjacent bars.
📐Formulae
💡Examples
Problem 1:
The number of students in five different classes are: Class 6: , Class 7: , Class 8: , Class 9: , Class 10: . If you are drawing a bar graph with a scale of , what will be the heights of the bars for Class 7 and Class 10?
Solution:
- Identify the scale: .
- For Class 7: Height = .
- For Class 10: Height = .
Explanation:
To determine the height of the bars on the graph, divide the actual data value by the value represented by one unit of the scale.
Problem 2:
A double bar graph compares the marks of a student in Term 1 and Term 2. For Mathematics, the Term 1 bar is high and the Term 2 bar is high. If the scale is , calculate the increase in marks.
Solution:
- Marks in Term 1 = .
- Marks in Term 2 = .
- Increase in marks = .
Explanation:
First, convert the bar heights into actual values by multiplying by the scale factor. Then, find the difference between the two values to determine the improvement or change.
Problem 3:
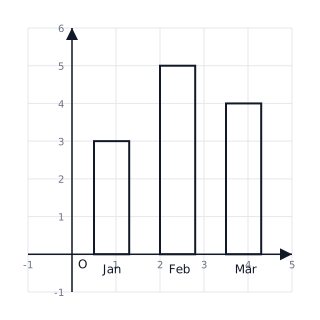
The following data shows the number of cars sold by a showroom over three months: January: , February: , March: . Construct a bar graph. What is the height of the bar for February if the scale is ?
Solution:
- Identify the values: Jan = , Feb = , Mar = .
- Given scale: .
- Calculate height for February: .
- Heights for others: Jan = , Mar = .
Explanation:
The height of each bar is determined by dividing the actual value by the scale factor. For February, units on the graph.
Problem 4:
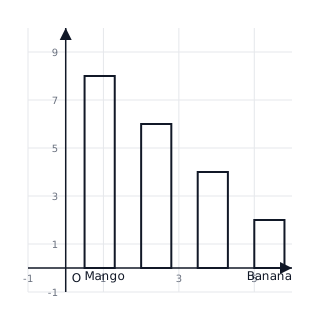
A survey of students shows their favorite fruits: Mango: , Apple: , Orange: , Banana: . If a bar graph is drawn with a scale of , find the difference in heights between the bars for Mango and Banana.
Solution:
- Scale: .
- Height of Mango bar = .
- Height of Banana bar = .
- Difference in heights = .
Explanation:
We first convert the number of students into graph units using the scale. Mango requires 8 units and Banana requires 2 units. The difference is units.