
Review the key concepts, formulae, and examples before starting your quiz.
🔑Concepts
A pie chart is a circular statistical graphic, which is divided into slices (sectors) to illustrate numerical proportion. The entire circle represents the total frequency or 100% of the data.
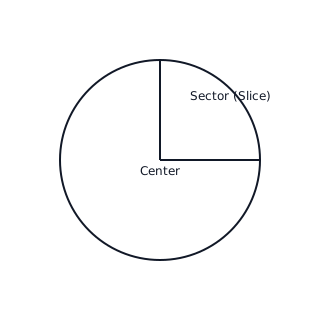
The angle of each sector is directly proportional to the frequency it represents. The sum of all sector angles in a pie chart must always equal .
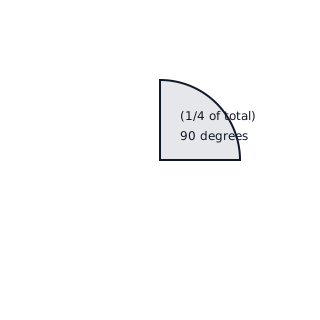
To construct a pie chart, calculate the angle for each category using the formula: . Use a protractor to measure these angles accurately from the center.
Comparing pie charts: Pie charts are best for showing how a whole is divided. However, if two pie charts represent different total sample sizes, the same angle in both charts does not represent the same absolute frequency.
📐Formulae
💡Examples
Problem 1:
In a survey of 60 students, 15 students said their favorite fruit is Apple. Calculate the angle of the sector for 'Apple' in a pie chart.
Solution:
Explanation:
To find the angle, use the formula: . Here, . This represents a quarter of the circle.
Problem 2:
A pie chart represents the types of pets owned by 120 people. The sector for 'Dogs' has an angle of . How many people own dogs?
Solution:
36 people
Explanation:
To find the value from the angle, use the formula: . Here, .
Problem 3:
A pie chart is divided into three sections: Red, Blue, and Green. If Red is and Blue is , what is the angle for the Green section?
Solution:
Explanation:
The sum of all angles in a pie chart must be . Subtract the known angles from the total: .
Problem 4:
A group of 40 students were asked about their favorite sport. 10 students chose Football, 20 chose Basketball, and 10 chose Tennis. Calculate the sector angles and visualize the data.
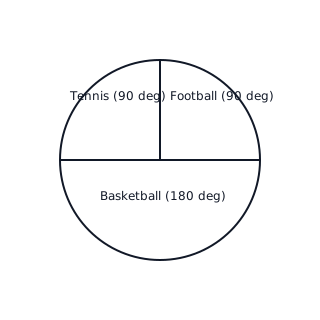
Solution:
- Total frequency =
- Angle for Football:
- Angle for Basketball:
- Angle for Tennis: Check: .
Explanation:
We first find the fraction of the total for each sport, then multiply that fraction by the available in a circle to find the corresponding angle.
Problem 5:
A pie chart shows the distribution of vehicles in a parking lot. The sector for 'Electric Cars' is . If there are 200 vehicles in total, how many electric cars are there?
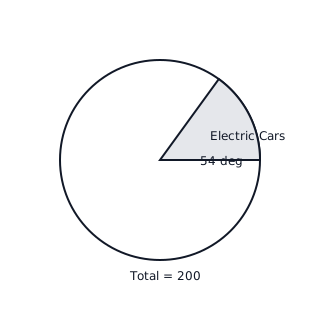
Solution:
- Identify the angle:
- Identify the total vehicles:
- Use the formula:
- Calculation: .
Explanation:
To find the actual quantity from an angle, we divide the given angle by to find the proportion of the circle, then multiply by the total population.