
Review the key concepts, formulae, and examples before starting your quiz.
🔑Concepts
Line graphs are used to show how data changes over time. They consist of two axes: the horizontal x-axis (usually time) and the vertical y-axis (the measured variable). Points are plotted and connected with straight lines to show the trend.
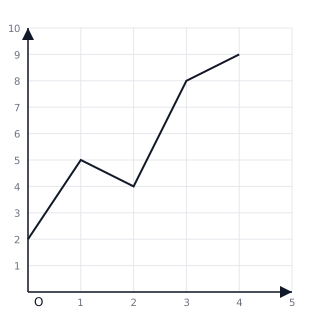
The steepness of the line indicates the rate of change. A steep line means a rapid increase or decrease, while a flat line means the value remained constant over that interval.
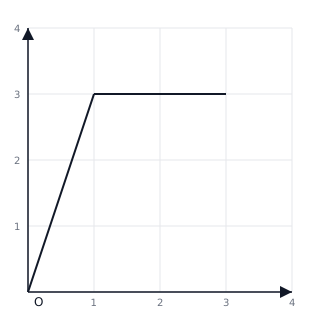
Interpreting points involves looking directly across to the y-axis for values and down to the x-axis for specific times. To find a difference, subtract the initial value from the final value.
When constructing a line graph, choose a scale for the y-axis that covers the entire range of data. Ensure intervals are equal, such as counting in , , or .
📐Formulae
💡Examples
Problem 1:
A line graph shows the temperature in a classroom. At 09:00, the temperature was . At 12:00, the line rises to . What is the increase in temperature between 09:00 and 12:00?
Solution:
Explanation:
To find the increase, identify the values on the y-axis for both time points on the x-axis and subtract the earlier value from the later value.
Problem 2:
On a graph tracking a seedling's height, the points are: Day 1 (2cm), Day 2 (4cm), Day 3 (6cm). If the trend continues, what will the height be on Day 5?
Solution:
10cm
Explanation:
The graph shows a steady increase of 2cm per day. To find the value for Day 5, we continue the pattern: Day 4 would be , and Day 5 would be .
Problem 3:
If the y-axis of a graph starts at 0 and has 5 equal intervals reaching up to 50, what is the value of each grid line?
Solution:
10 units per line
Explanation:
To find the scale interval, divide the total range by the number of intervals: .
Problem 4:
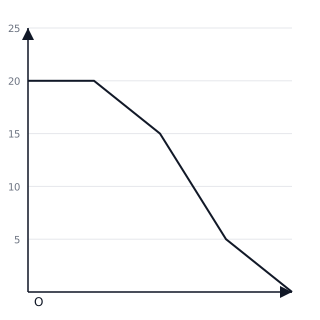
The graph shows the volume of water in a tank over 4 hours. How much water was lost between Hour 2 and Hour 3?
Solution:
Explanation:
Identify the volume at Hour 2, which is . Identify the volume at Hour 3, which is . The difference is .
Problem 5:
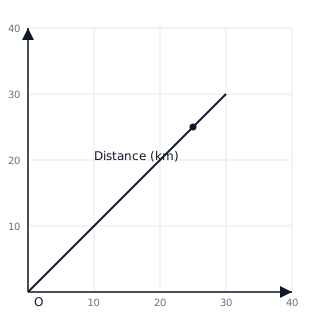
A car travels at a steady speed. Plot the distance covered: 0 mins (), 10 mins (), 20 mins (), 30 mins (). What is the distance at 25 minutes?
Solution:
Explanation:
The points form a straight diagonal line. By finding 25 on the time axis and moving up to the line, the corresponding distance on the y-axis is .