
Review the key concepts, formulae, and examples before starting your quiz.
🔑Concepts
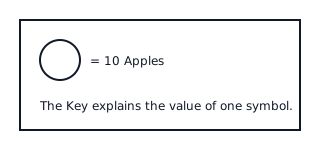
A Pictograph is a way of representing data using pictures or symbols. Each symbol stands for a specific number of items, which is called the 'Key'.
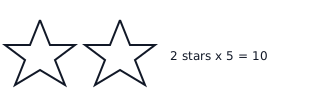
To find the total value of a category, count the symbols and multiply by the value given in the key. For example, if star represents marks, then stars represent marks.
Sometimes a partial symbol is used to represent a smaller value. If a full circle represents people, a half-circle represents people ().

Pictographs help us compare different groups quickly by seeing which row has more symbols.
📐Formulae
💡Examples
Problem 1:
In a school garden pictograph, flower symbol represents plants. If the row for 'Roses' has full flower symbols and half-flower symbol, how many rose plants are there in total?
Solution:
Explanation:
First, find the value of the full symbols by multiplying the count () by the key (). Then, find the value of the half symbol by dividing the key by . Finally, add both values together to get the total.
Problem 2:
A shopkeeper sold ice creams on Sunday. He wants to draw a pictograph where ice cream cone symbol represents ice creams. How many symbols should he draw for Sunday?
Solution:
Explanation:
To find the number of symbols needed for the chart, divide the total quantity of items sold by the value assigned to a single symbol in the key.
Problem 3:
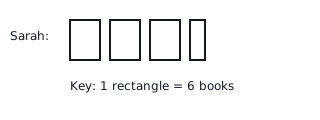
The following pictograph shows the number of books read by four friends in a month. If each book symbol represents books, how many books did Sarah read if her row has full symbols and half symbol?
Solution:
- Value of 1 full symbol = books.
- Value of 1 half symbol = books.
- Number of full symbols for Sarah = .
- Value of full symbols = books.
- Total books = books.
Explanation:
To find the total, we multiply the number of full symbols by the key and then add the value of the partial symbol.
Problem 4:
A baker sold cupcakes on Monday. He wants to represent this in a pictograph where cupcake symbol represents cupcakes. How many symbols should he draw for Monday?

Solution:
- Total cupcakes sold = .
- Value of 1 symbol = cupcakes.
- Number of symbols = .
- The baker should draw cupcake symbols.
Explanation:
To find the number of symbols to draw, divide the total quantity by the value of one symbol as per the key.