
Review the key concepts, formulae, and examples before starting your quiz.
🔑Concepts
A pictograph uses pictures or symbols to represent data. It makes information easier to understand and compare at a glance.
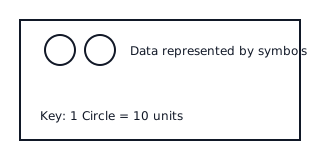
The 'Key' is the most important part of a pictograph. It tells us the value of one single symbol (e.g., smiley face = students).

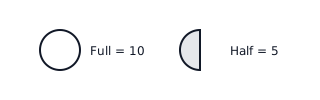
Sometimes a half-symbol is used. If a full symbol represents items, a half-symbol represents item.
To find the total number for a category, multiply the number of symbols by the value given in the key.
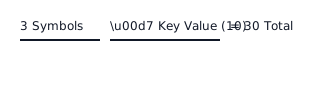
📐Formulae
💡Examples
Problem 1:
A pictograph shows the number of cupcakes sold by a bakery. The key says: cupcake symbol = real cupcakes. If the row for 'Friday' has cupcake symbols, how many cupcakes were sold on Friday?
Solution:
- Identify the value of one symbol from the key: symbol = cupcakes.
- Count the symbols for Friday: symbols.
- Multiply the number of symbols by the key value: .
Explanation:
To find the total, we take the count of pictures and multiply by what each picture stands for.
Problem 2:
In a school garden pictograph, flower symbol = plants. The 'Rose' section shows full flower symbols and half flower symbol. How many rose plants are there in total?
Solution:
- Value of full symbols: plants.
- Value of half symbol: plants.
- Add the values together: rose plants.
Explanation:
When we see a half symbol, we divide the key value by and add it to the total of the full symbols.
Problem 3:
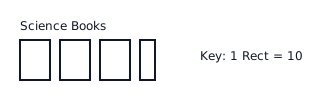
A pictograph tracks the number of books read by Grade 3 students. The key states: book symbol = books. If the 'Science' row has book symbols and half-book symbol, calculate the total number of science books read.
Solution:
- Identify the value of one full symbol: books.
- Identify the value of a half symbol: books.
- Count full symbols: symbols books.
- Add the half symbol: books. Total = books.
Explanation:
We multiply the number of whole symbols by the key value and then add the value of the partial symbol.
Problem 4:
A fruit seller uses a pictograph to show sales of oranges. If orange symbol = kg of oranges, and the pictograph shows full orange symbols for Monday, how many kilograms of oranges were sold?
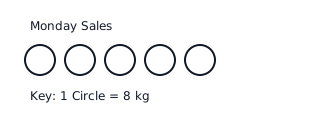
Solution:
- Number of symbols =
- Value per symbol = kg
- Total sales = kg Total = kg.
Explanation:
By looking at the key, we determine each symbol is 8 units. Since there are 5 symbols, we perform multiplication to find the sum.