
Review the key concepts, formulae, and examples before starting your quiz.
🔑Concepts
A box-and-whisker plot, or box plot, is a visual representation of the five-number summary: the Minimum, First Quartile (), Median (), Third Quartile (), and Maximum. The 'box' spans from to , representing the middle of the data.
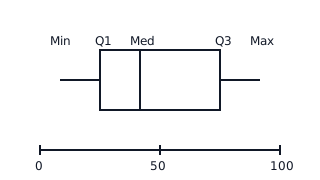
The Interquartile Range (IQR) measures the spread of the middle of the data. A smaller box indicates that the central data points are closely clustered around the median, while a wider box indicates higher variability.

Whiskers extend from the box to the minimum and maximum values. However, if outliers are present, whiskers extend to the furthest points within the 'fences' (boundaries), and outliers are marked individually with asterisks or dots.
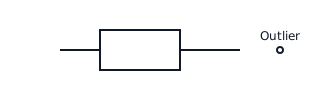
Symmetry in a box plot indicates the distribution shape. If the median is centered in the box and whiskers are of equal length, the distribution is symmetric. If the median is closer to , the data is positively skewed (right-skewed).
📐Formulae
💡Examples
Problem 1:
Given the dataset: 3, 7, 8, 5, 12, 14, 21, 15, 18. Calculate the 5-number summary and the IQR.
Solution:
- Order data: 3, 5, 7, 8, 12, 14, 15, 18, 21.
- Min = 3, Max = 21.
- Median (Q2) = 12 (the 5th value).
- Q1 = (5 + 7) / 2 = 6.
- Q3 = (15 + 18) / 2 = 16.5.
- IQR = 16.5 - 6 = 10.5.
Explanation:
To find quartiles, first find the median of the entire set. Then find the medians of the two halves created by the median. IQR is the difference between the upper and lower quartiles.
Problem 2:
A dataset has Q1 = 20 and Q3 = 35. Determine if a value of 60 is an outlier.
Solution:
- IQR = 35 - 20 = 15.
- Upper Boundary = Q3 + (1.5 * IQR) = 35 + (1.5 * 15) = 35 + 22.5 = 57.5.
- Since 60 > 57.5, the value 60 is an outlier.
Explanation:
Outliers are defined as values that exceed the upper boundary (Q3 + 1.5IQR) or fall below the lower boundary (Q1 - 1.5IQR).
Problem 3:
Compare two classes' test scores. Class A: Median 75, IQR 10. Class B: Median 70, IQR 25. Which class performed better and which was more consistent?
Solution:
- Class A performed better because its Median (75) is higher than Class B's (70).
- Class A was more consistent because its IQR (10) is smaller than Class B's (25).
Explanation:
In statistical comparison, a higher median indicates a higher average achievement, while a smaller IQR indicates less spread/variability, meaning the scores are more consistent.
Problem 4:
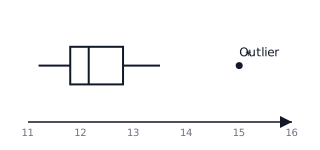
An athlete records their sprint times (in seconds) over 10 trials: . Construct a box plot and identify if the second trial is an outlier using the rule.
Solution:
- Find the 5-number summary:
- Min
- (lower quartile) is the median of the first 5 values:
- Median (middle of and )
- (upper quartile) is the median of the last 5 values:
- Max
- Calculate IQR:
- Calculate Upper Boundary:
- Compare: Since , the value is an outlier.
Explanation:
To determine outliers, we first locate the quartiles to find the IQR. Any value beyond is statistically considered an outlier. The box plot will show a whisker ending at the highest non-outlier value () and a separate point for .
Problem 5:
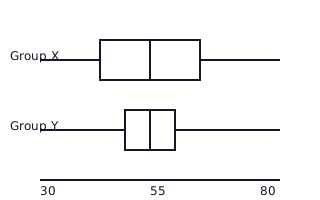
Compare the test results of two groups of students. Group X: . Group Y: . Both groups have a Min of and Max of . Which group is more consistent?
Solution:
- Calculate IQR for Group X:
- Calculate IQR for Group Y:
- Since Group Y has a smaller IQR (), the middle of its scores are more tightly packed around the median.
Explanation:
Consistency in statistics is often measured by the spread of the data. While both groups have the same median and total range, the interquartile range (the width of the box) tells us how varied the central half of the students' performance is. Group Y is more consistent.