
Review the key concepts, formulae, and examples before starting your quiz.
🔑Concepts
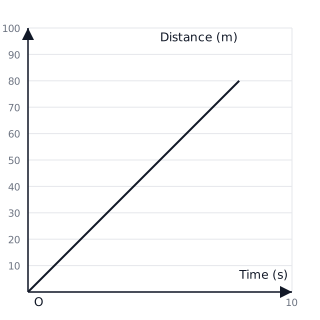
In a Distance-Time graph, the gradient (slope) represents the speed of the object. A straight diagonal line indicates constant speed, while a horizontal line shows the object is stationary. A curve indicates changing speed (acceleration or deceleration).
The gradient of a Velocity-Time graph represents the acceleration of the object. If the gradient is positive, the object is accelerating; if negative, it is decelerating. A horizontal line indicates constant velocity (zero acceleration).
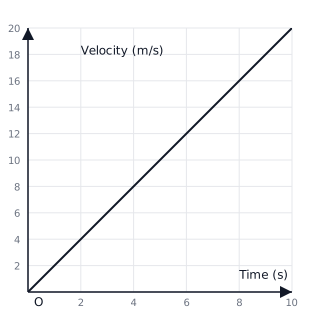
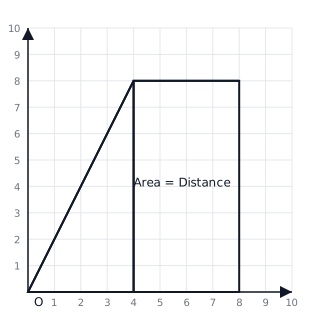
The area under a Velocity-Time graph is equal to the total displacement (or distance in a single direction) traveled by the object. For complex shapes, the area can be split into rectangles and triangles to simplify calculations.
Average speed for a whole journey can be calculated by dividing the total distance by the total time taken, regardless of individual speed changes represented on the graph.
📐Formulae
💡Examples
Problem 1:
A car's motion is plotted on a distance-time graph. It travels in at a constant rate. Calculate its speed.
Solution:
Explanation:
Since the speed is constant, the gradient of the distance-time graph is , which equals .
Problem 2:
An athlete starts from rest and reaches a velocity of in on a velocity-time graph. Find the acceleration.
Solution:
Explanation:
Acceleration is the change in velocity divided by time, represented by the gradient of the graph.
Problem 3:
Calculate the total distance traveled for an object that moves at a constant velocity of for .
Solution:
Explanation:
On a velocity-time graph, this motion is represented by a horizontal line. The area of the rectangle formed () gives the distance: .
Problem 4:
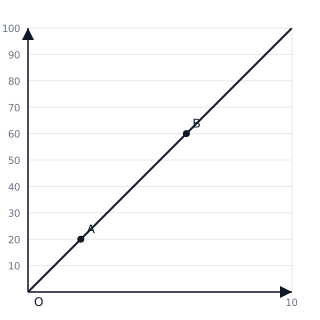
A cyclist travels along a straight road. Their motion is captured in the provided distance-time graph. Determine the speed of the cyclist between and .
Solution:
Explanation:
The speed is the gradient of the distance-time graph. By selecting the coordinates and , we calculate the change in distance over the change in time.
Problem 5:
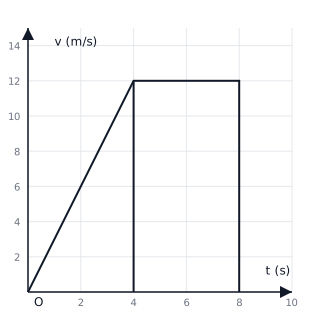
An object accelerates from rest to in , then maintains this velocity for . Calculate the total distance traveled during these using the velocity-time graph.
Solution:
Explanation:
The distance traveled is represented by the total area under the velocity-time graph. We split the shape into a triangle (for the acceleration phase) and a rectangle (for the constant velocity phase).