
Relations and Functions - Some functions and their graphs: Identity, Constant, Polynomial, Rational, Modulus, Signum, Greatest Integer Function
Review the key concepts, formulae, and examples before starting your quiz.
🔑Concepts
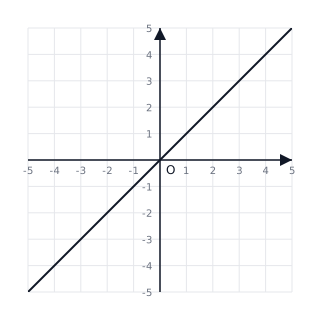
The Identity Function is defined by such that for each . The domain and range are both , and the graph is a straight line passing through the origin at a angle.
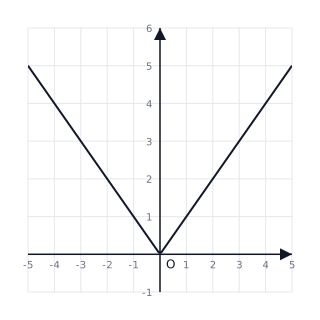
The Modulus Function (or absolute value function) maps every real number to its non-negative value. The domain is and the range is . The graph is V-shaped.
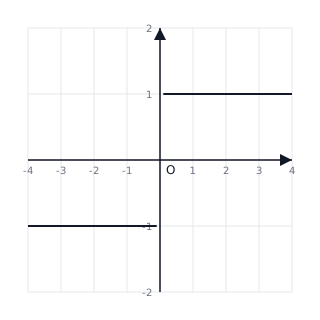
The Signum Function outputs for , for , and for . It is used to extract the sign of a real number.
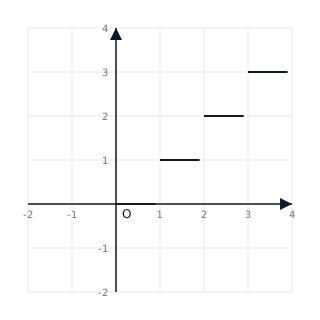
The Greatest Integer Function (Floor function) returns the greatest integer less than or equal to . Its graph consists of horizontal line segments resembling steps.
📐Formulae
Identity Function:
Constant Function:
Modulus Function:
Signum Function:
Greatest Integer Function: , where and
Rational Function condition:
💡Examples
Problem 1:
Find the domain and range of the function .
Solution:
- For any real number , the expression is always defined. Therefore, the Domain of is .
- By definition of the modulus function, for all .
- The smallest value occurs when , where . As increases or decreases from 2, increases towards .
- Thus, the Range is .
Explanation:
The modulus function always produces non-negative outputs, shifting the vertex of the V-shaped graph to .
Problem 2:
Evaluate the value of the expression .
Solution:
- Using the definition of the Greatest Integer Function: is the greatest integer , which is .
- For the negative value: is the greatest integer , which is .
- Using the Signum Function definition: since , .
- Substituting these values into the expression: .
Explanation:
This problem applies the step-wise definition of the Greatest Integer Function and the piecewise definition of the Signum Function.
Problem 3:
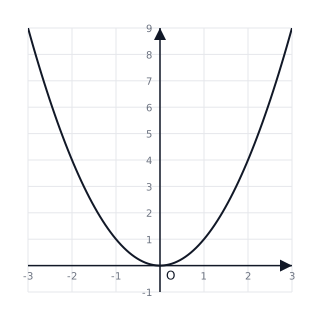
Sketch the graph of the polynomial function for . State its domain and range.
Solution:
The domain is because the square of any real number is defined. Since the square of a number is always non-negative, the range is . The table of values includes . Connecting these points gives a parabola opening upwards.
Explanation:
Polynomial functions of the form behave differently based on whether is even or odd. For , the function is symmetric about the y-axis.
Problem 4:
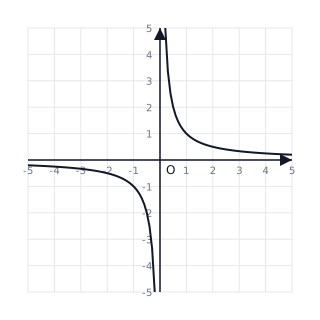
Identify the features of the reciprocal function and visualize its graph.
Solution:
The domain is and the range is also . As becomes very large, approaches . As approaches from the positive side, approaches . The graph exists in the first and third quadrants.
Explanation:
This is a basic rational function where the denominator cannot be zero, creating a vertical asymptote at and a horizontal asymptote at .