
Review the key concepts, formulae, and examples before starting your quiz.
🔑Concepts
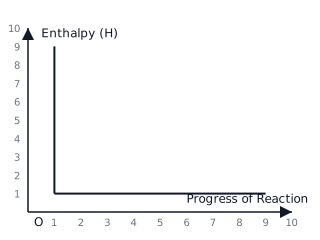
Energy Level Diagrams (Enthalpy Profile Diagrams) visually represent the relative energy levels of reactants and products during a chemical reaction. The y-axis represents enthalpy () and the x-axis represents the progress of the reaction.
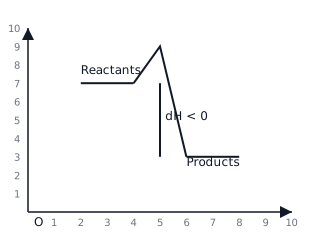
In an Exothermic reaction, the enthalpy of the products is lower than the enthalpy of the reactants (). Energy is released to the surroundings, resulting in a negative enthalpy change ().
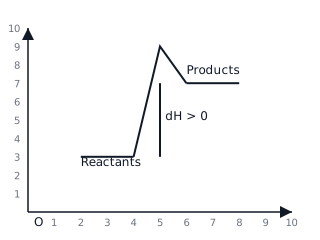
In an Endothermic reaction, the enthalpy of the products is higher than the enthalpy of the reactants (). Energy is absorbed from the surroundings, resulting in a positive enthalpy change ().
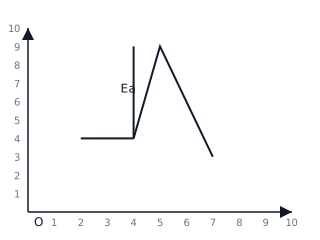
Activation Energy () is the minimum energy required for a reaction to occur. On an energy level diagram, it is represented by the 'hump' or the vertical distance from the energy of the reactants to the peak of the curve.
📐Formulae
💡Examples
Problem 1:
The combustion of methane is represented by the equation: with . Describe the energy level diagram for this reaction.
Solution:
The reactants () are placed at a higher energy level than the products (). A curve rises from the reactant level to a peak (representing ) and then drops significantly to the product level. The downward arrow from reactants to products indicates .
Explanation:
Because is negative, the reaction is exothermic. Energy is lost to the surroundings, meaning the chemical system loses potential energy, placing products 'lower' on the graph than reactants.
Problem 2:
Calculate the enthalpy change () for the reaction given the bond energies: , , and . Determine if it is endothermic or exothermic.
Solution:
Explanation:
Since is negative (), the reaction is exothermic. More energy is released during the formation of bonds than is required to break the and bonds.
Problem 3:
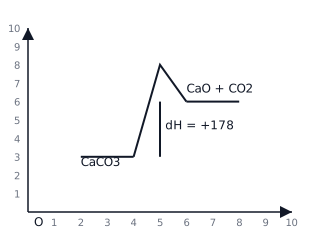
Draw the energy level diagram for the thermal decomposition of calcium carbonate (), which is an endothermic reaction with . Label the reactants, products, and .
Solution:
- Identify that the reaction is endothermic, so the product level must be higher than the reactant level.
- Draw the reactant line () at a lower energy level.
- Draw the product line () at a higher energy level.
- Connect them with a curve showing the activation energy.
- Mark the difference between the levels as .
Explanation:
Because heat is absorbed from the surroundings to break the bonds in calcium carbonate, the internal energy (enthalpy) of the system increases.
Problem 4:
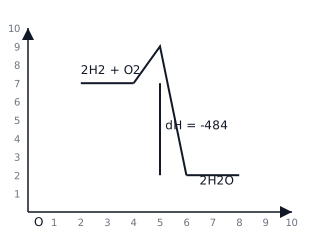
The reaction between hydrogen and oxygen to form water () releases of energy. Represent this as an energy level diagram showing the enthalpy change.
Solution:
- Identify that 'releasing energy' means the reaction is exothermic.
- Draw the reactant line () at a higher energy level.
- Draw the product line () at a lower energy level.
- Represent the enthalpy change as .
Explanation:
Energy is released when the new bonds in water are formed, resulting in products that have less chemical potential energy than the reactants.